Dow Jones Industrial Average Holds Near 46,500 Amid Diverging Volume Signals and Technical Buy Outlook
06.04.2026 - 17:46:45 | ad-hoc-news.de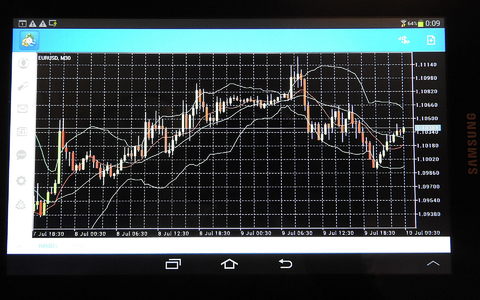
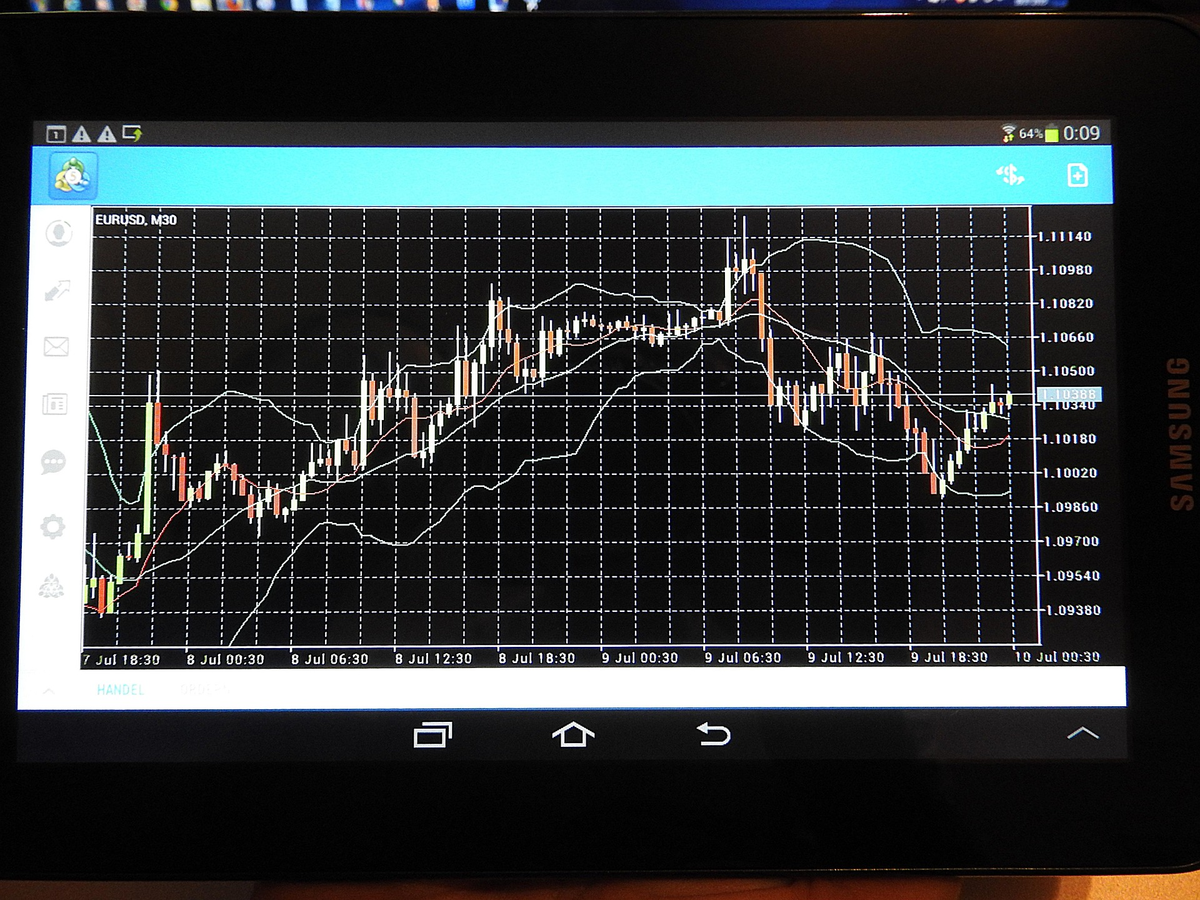
The **Dow Jones Industrial Average** (DJIA) ended its last trading session at **46,504.68 points**, marking a modest decline of **0.131%**, as market participants digest mixed technical signals including falling volume amid recent price gains. This positioning leaves the index in a **buy candidate** status according to updated forecasts, with key support at 43,819.26 points and potential for a 9.80% rise over the next three months. For U.S. investors tracking blue-chip stability, this development underscores the index's resilience in a low-volatility environment, where controlled movements offer low risk but warrant close monitoring of volume trends.
As of: Monday, April 06, 2026, 11:46 AM ET (America/New_York)
Technical Setup Points to Cautious Optimism
The DJIA's recent performance shows a pattern of controlled fluctuations, with the index moving **293.87 points** or **0.658%** between highs and lows on the last detailed trading day analyzed. Short-term moving averages emit buy signals, reinforced by the short-term average trading above the long-term average, fostering a positive forecast. However, a divergence emerges from declining volume during price advances, signaling potential early warnings for shifts in momentum over coming sessions.
Accumulated volume identifies critical support at **43,819.26 points**, where buying opportunities may arise on tests of this level. Resistance sits at **45,010.30 points**, a 0.241% step above recent levels, with further upside targets at **45,142.44 points** indicating stronger bullish momentum. Weekly volatility averages **0.661%**, underscoring the index's characteristically low-risk profile suitable for conservative U.S. portfolios.
Recent Price Action and Volume Dynamics
From a prior session close at **44,901.91 points** after a **0.465%** gain, the index has demonstrated upward bias in 6 of the last 10 days, accumulating **1.2%** over two weeks. Yet, volume dropped sharply by 80 million shares to 368 million, transacting approximately **16.53 trillion points** in value—a divergence that analysts flag as a watch point. Current open levels around **46,472.20 points** with previous close at **46,504.67 points** reflect ongoing range-bound trading within **0.62%** intraday swings.
This setup aligns with broader **Dow Jones today** patterns where liquidity remains high, but volume-price mismatches prompt vigilance. For Dow-linked ETFs like DIA, these dynamics translate to steady tracking with minimal tracking error, appealing to income-focused U.S. investors seeking exposure without excessive volatility.
Forecasts Signal 9.80% Upside Potential
Analysts project a **9.80%** rise over the next three months, targeting a range of **48,085.36 to 49,567.68 points** with 90% probability. Near-term expectations for the subsequent trading day anticipated opens near **44,832.32 points**, with swings of +/- **395.43 points** or **0.88%** based on 14-day Average True Range. A stop-loss recommendation at **43,363.26 points** (-3.43%) highlights downside protection amid low daily movements.
Overall score upgrades to **2.287 Buy Candidate**, shifting from prior Hold status, driven by positive short-term signals and trend alignment. U.S. investors in **Dow futures** via CME contracts may position accordingly, distinguishing cash index levels from futures premiums that often lead premarket sentiment.
Support and Resistance Framework
Key levels form a structured trading framework:
- R1: 45,010.30 points (+0.241%)
- Current Price: 44,901.91 points (reference)
- S1: 43,819.26 points (-2.41%)
- S2: 42,322.75 points (-5.74%)
- S3: 42,270.07 points (-5.86%)
These thresholds guide risk management, with breakdowns below supports triggering sell signals, while holds reinforce buy bias. In a **DJIA**-specific context, such levels matter for institutional rebalancing, where the index's price-weighted methodology amplifies higher-priced components like UnitedHealth or Goldman Sachs on moves.
Distinguishing Index from Components and Derivatives
The **Dow Jones Industrial Average** tracks 30 blue-chip constituents via price-weighting, distinct from equal-weight or market-cap approaches in S&P 500 or Nasdaq. Recent gainers numbered 18 in sampled sessions, with 52-week highs at **50,512.79 points** and unspecified lows reflecting yearly range. **Dow Inc.** (DOW), a chemical producer, remains separate from the index nomenclature—never conflated in analysis.
Dow-linked ETFs/ETPs, such as State Street's DIA, mirror cash index performance, while CME **Dow futures** (/YM) trade independently, often signaling premarket direction. Current volume at **48.42 million** underscores liquidity, but investors must parse cash closes like **46,504.68 points** from futures settlements.
Implications for U.S. Investors
For U.S. investors, the DJIA's low-volatility profile—daily moves averaging under 1%—supports allocation in 401(k)s, IRAs, and tactical overlays. Amid energy sector headlines influencing oil futures, the index's diversified exposure (18 gainers recently) buffers single-sector risks. Technology and energy rotations appear secondary to technical drivers here, keeping focus on index-level mechanics.
Risk appetite remains constructive, with MACD sell signals on three-month views offset by moving average buys. Sector rotation into industrials or financials—key Dow weights—could amplify upside, but volume divergence tempers enthusiasm. Treasury yields or Fed expectations, while macro influencers, lack direct recent linkage in this snapshot, prioritizing technicals.
Broader Market Divergences and Watch Points
Unlike Nasdaq's tech-heavy swings, the DJIA's blue-chip ballast often diverges during risk-off phases, as seen in controlled **0.62%** ranges. If S&P 500 outperforms on growth names, Dow lag may emerge, but current buy signals suggest outperformance potential versus broader benchmarks.
Geopolitical or tariff risks, historically Dow-sensitive via components like Boeing or Caterpillar, stay dormant absent fresh catalysts. Earnings season proximity could shift focus to heavyweights, but technicals dominate now.
Trading Strategies and Risk Management
Position sizing around recommended stop-losses at **43,363.26 points** suits low-risk appetites. Long bias favors dips to supports, with scalps targeting R1 at **45,010.30 points**. Options on Dow ETPs offer convexity for volatility plays, distinct from cash index exposure.
Institutional flows into **Dow Jones Industrial Average** ETFs signal confidence in stability, with volume drops not yet derailing trend. U.S. retirees or dividend seekers benefit from constituent yields, averaging above broader market amid rate uncertainty.
Historical Context for Current Positioning
Over recent weeks, the index rose **1.2%**, building from pivots like **44,693.90 points**. This extends a multi-month grind higher, with 52-week highs (**50,512.79 points**) capping ambition. Corrections find bids at moving average clusters (**44,608.33 points**, **43,678.21 points**).
Price-weighting quirks—where Goldman Sachs' share price sways more than Intel's—differentiate DJIA mechanics, explaining occasional benchmark divergences. Investors adjust via futures for precise hedging.
Next Catalysts and Monitoring Tools
Upcoming economic prints (inflation, jobs) could jolt yields, transmitting via financials (10%+ Dow weight). Absent breaks of supports, technical buy thesis holds. Track volume for confirmation; rebounds validate upside.
Dow futures premarket provide leading clues, separate from cash opens. ETF flows via issuers like State Street gauge sentiment.
Further Reading
Dow Jones Technical Forecast and Signals
DJIA Live Price and Volume Data
Dow Jones Energy Headlines
Disclaimer: Not investment advice. Indices, ETFs and financial instruments are volatile.
So schätzen die Börsenprofis Aktien ein!

Für. Immer. Kostenlos.