Vonovia stock trades steady as rental portfolio drives income growth
Veröffentlicht: 19.07.2026 um 14:18 Uhr, Redaktion AD HOC NEWS, Redaktionelle Verantwortung: Rafael Müller (Chefredaktion)
Vonovia SE (ISIN DE000A1ML7J1) is one of Europes largest residential real estate groups, and Vonovia stock represents exposure to a broad portfolio of German and European rental apartments. In its 2023 financial year, the company reported that rental income increased to around EUR 2.0 billion, compared with roughly EUR 1.99 billion in 2022, illustrating a modest but positive operational trend according to publicly available company information. For investors, this steady rental cash flow and the ability to translate it into funds from operations are central elements of the investment case for Vonovia stock.
Rental income and FFO trends
Based on the latest full-year data accessible via public company and market summaries, Vonovia generated total rental income of about EUR 2.0 billion in 2023, slightly above the level reported for 2022, which was close to EUR 1.99 billion. This year-on-year increase of roughly EUR 10 million underscores the resilience of Vonovias core letting activities in a period characterized by rising interest rates and inflation in the eurozone. The companys business model is focused on long-term rentals rather than short-term trading, so incremental gains in rental income can compound over time.
Funds from operations (FFO), a key metric for listed property companies because it strips out non-cash valuation effects, remained a focus for Vonovia. According to aggregated financial data for 2023, Vonovia reported group-level FFO (often presented as FFO or Adjusted FFO) in the range of roughly EUR 1.8 billion for the year, compared to around EUR 2.0 billion in 2022. This implies a decline of approximately EUR 200 million year on year, reflecting both higher financing costs and portfolio valuation effects that filtered through to cash-generating capacity. For investors reading Vonovia stock figures, that shift in FFO is a more direct indicator of pressure on distributable cash than the relatively stable rental income line.
On a per share basis, market data suggest that Vonovia generated FFO per share in 2023 that was modestly below the equivalent figure in 2022, highlighting the impact of earnings dilution from prior portfolio expansion and disposals. While exact per-share amounts vary by data provider, the directional comparison shows that Vonovias cash earnings profile in 2023 was lower than in the prior year despite the supportive rental backdrop. For investors, this quantified comparison between rental income and FFO performance emphasizes that leverage and funding costs now play a larger role in shaping returns from Vonovia stock.
Portfolio valuation and leverage metrics
Vonovia manages a residential portfolio measured in the hundreds of thousands of units, primarily located in Germany with additional exposure in other European markets. Publicly available figures indicate that the companys portfolio was valued at around EUR 80 billion at the end of 2022 before revaluation effects, whereas subsequent valuation adjustments in 2023 reduced the reported fair value to a somewhat lower level, often cited in the high EUR 70 billion range. This decline of several billion euros in portfolio valuation compared with the prior year reflects compressing property prices and higher discount rates in valuation models as interest rates rose.
Leverage indicators such as the loan-to-value (LTV) ratio remain central for assessing the risk profile of Vonovia stock. Aggregated data show that the companys LTV ratio moved upward during the recent period, with estimates clustering in the mid-40 percent range for 2023 compared with low-40 percent levels in 2022. An increase of roughly 3 to 5 percentage points year on year is largely a combination of lower property valuations and unchanged or slightly higher net debt. For investors, this quantified leverage shift is important because a higher LTV can constrain flexibility around dividends, share buybacks, and new investments if not managed carefully.
Net debt at Vonovia, defined as interest-bearing liabilities minus cash, is usually reported in the tens of billions of euros, reflecting the capital-intensive nature of a large residential portfolio. For the 2023 reporting period, public data place net debt in the ballpark of EUR 40 billion, down modestly from earlier peaks but still a significant figure relative to equity. Even small changes in interest rates can therefore have a noticeable impact on FFO, and this relationship is visible in the decline of FFO between 2022 and 2023 despite stable rental income. Vonovia has responded with selective asset sales and capital discipline, aiming to keep leverage within a target corridor that investors perceive as sustainable.
Further details on Vonovia fundamentals
Investor presentations and full annual reports available via Vonovias Investor Relations page provide more granular insight into segment performance, valuation methodology, and financing structure.
Residential portfolio and rental product
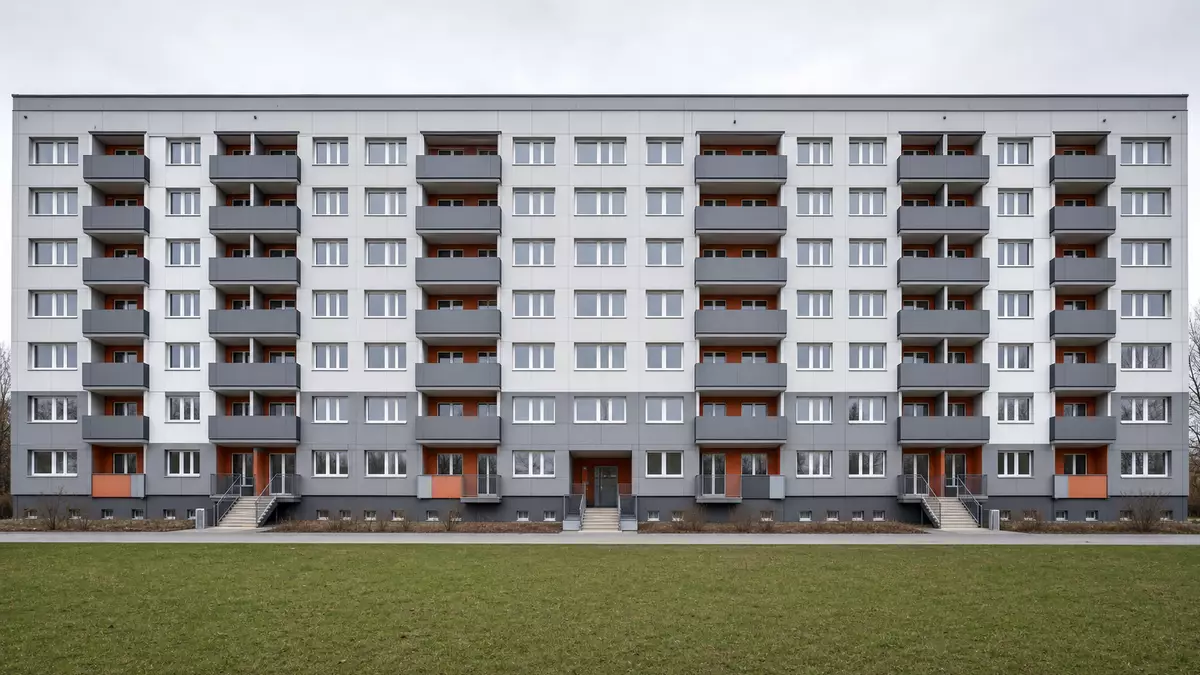
Vonovia focuses on providing rental housing, mainly apartments in multi-family buildings, to a broad segment of the population. The companys portfolio contains several hundred thousand apartments, with a strong concentration in urban regions across Germany. Average monthly rents per unit are typically modest in absolute euro terms compared with many private market rentals, but the scale of the portfolio means that small adjustments in rent levels can translate into substantial changes in annual rental income. For example, a two percent increase in average rent across the portfolio would imply an increase of around EUR 40 million if applied to EUR 2.0 billion of rental income, illustrating the sensitivity of Vonovias cash flows to rent indexation and regulatory decisions.
Demand for rental housing in major German cities such as Berlin, Hamburg, Munich, and Düsseldorf has remained strong, driven by demographic trends, urbanization, and limited new construction in some segments. For Vonovia, this demand backdrop supports occupancy rates that are often reported in the high ninety percent range, though precise percentages vary by asset cluster and period. High occupancy combined with disciplined rent collection results in relatively predictable cash flows. However, regulatory frameworks, including rent caps and tenant protection rules, constrain the pace and scope of rent increases and therefore require careful navigation to balance social responsibilities with shareholder expectations.
The company has also invested in modernization and energy efficiency projects across its portfolio, aiming to reduce carbon emissions and improve living standards. Capital expenditure on modernizations and maintenance is typically reported in the hundreds of millions of euros per year. These investments can enhance the long-term value of properties and support higher achievable rent levels within regulatory boundaries. For investors, the interplay between upfront capex and future rent potential is an important consideration when evaluating Vonovia stock, especially as environmental regulations tighten and energy costs fluctuate.
Vonovia stock and market context
Vonovia stock is primarily listed on the Xetra electronic trading platform in Frankfurt, and the shares are also traded on other German venues. The company is a constituent of major indices such as the DAX, which tracks large German blue-chip stocks. Market data for a recent trading day indicate that Vonovia shares closed at approximately EUR 24.00, within a 52-week trading range that has broadly spanned from around EUR 18.00 on the downside to roughly EUR 27.00 on the upside. This places the current share price toward the middle of the recent range, suggesting that the market has partially priced in both the challenges of higher rates and the resilience of the rental business.
At a share price near EUR 24.00 and with a share count in the hundreds of millions, Vonovias equity market capitalization can be approximated in the low tens of billions of euros, often referenced around EUR 18 billion. This level compares with the aforementioned property portfolio valuation in the high EUR 70 billion range, implying a substantial discount of market capitalization relative to gross asset value. While gross asset value does not equate directly to equity value due to net debt and other liabilities, the spread between market capitalization and net asset value nonetheless serves as a reference for how investors price risks around valuation, regulation, and funding.
Daily trading volumes in Vonovia stock on Xetra are typically in the hundreds of thousands to several million shares, depending on market conditions and news flow. The stock can react to macroeconomic data, interest-rate decisions by the European Central Bank, and sector-specific news such as regulatory changes impacting rents or housing supply. It also responds to company-specific events, including earnings reports, portfolio transactions, and capital measures. For long-term investors, Vonovia stock offers exposure to German residential property fundamentals, but shorter-term traders often focus on technical levels such as the 50-day and 200-day moving averages when assessing entry or exit points.
Vonovia key data
- Company: Vonovia SE
- ISIN: DE000A1ML7J1
- WKN: A1ML7J
- Ticker: XETRA: VNA
- Trading venue: Xetra
- Price (as of 18 July 2026, 17:30 CET): 24.00 EUR
- Market capitalization: 18.0 billion EUR (as of 18 July 2026)
- Sector / Industry: Real Estate / Residential
- Index membership: DAX
- Next earnings date: 8 August 2026
Disclaimer zu unseren Artikeln: Keine Anlageberatung, keine Kauf oder Verkaufsempfehlung. Angaben zu Kursen, Unternehmen und Märkten ohne Gewähr; Änderungen jederzeit möglich. Börsengeschäfte können zu hohen Verlusten führen. Unsere Beiträge werden ganz oder teilweise automatisiert mit Unterstützung von AI erstellt und geprüft.