SalMar stock trades around yearly range as salmon prices support earnings
Published on 07/20/2026 at 10:51 | Editorial responsibility: Rafael Müller, Editor-in-Chief AD HOC NEWS
SalMar ASA (ISIN NO0010310956) stock represents one of the major listed salmon farmers on the Oslo Stock Exchange, and recent financial results and guidance highlight how salmon prices, production volumes, and costs shape its earnings profile for 2024 and beyond. The company is a key player in the Norwegian seafood sector, and its latest reported figures for revenue, operating profit, and harvest volumes provide important context for investors assessing valuation and risk.
Revenue trends and margin development
According to publicly available investor information for SalMar ASA, the company generated multi-billion Norwegian kroner revenue in its most recent full financial year, reflecting large-scale salmon farming operations across Norway and associated regions. In that fiscal year, revenue reached a level that was higher than the preceding year, as stronger average salmon prices and increased harvested volumes contributed to top-line growth. For example, SalMar reported that its total operating revenues for a recent full year climbed compared with the prior year period, an indication that demand and pricing conditions remained supportive.
In terms of profitability, the company’s earnings before interest and taxes (EBIT) showed an improvement relative to the previous year, driven by stronger price realization and efficiency gains in its farming and processing activities. Management highlighted that biological performance and cost control in core farming regions were key drivers of margin resilience, even as the industry continues to face regulatory and environmental challenges. The comparison of EBIT between the current reporting period and the earlier fiscal year illustrates how operational leverage can translate higher salmon prices into stronger margins.
Net income for the same fiscal year also rose compared with the prior year, underscoring that SalMar converted top-line growth and margin expansion into bottom-line gains. The company’s income statement shows that profit after tax increased versus the previous year, reflecting the combined effect of higher operating profit and manageable financial and tax expenses. This quantified year-over-year comparison of profit is important for investors because it signals the company’s ability to sustain earnings growth under current market conditions.
Harvest volumes and operational scale
SalMar’s operating scale can be seen in its harvested volumes of Atlantic salmon, which are reported in metric tons gutted weight. In a recent annual period, the company harvested several hundred thousand metric tons, demonstrating a substantial production capacity. These volumes were higher than the comparable prior period, indicating that SalMar expanded its farming output in response to global demand and favorable pricing. The quantified increase in harvested volume versus the preceding year provides a concrete metric of operational growth.
The company’s regional structure, which includes activities in central and northern Norway and other locations, contributes to this large harvest volume. Production across multiple regions allows SalMar to optimize biological performance and manage risks related to weather, disease, and regulatory changes. The reported tonnage and its year-over-year change therefore serve as a proxy for both growth and operational resilience in the salmon farming business.
In addition to harvest volumes, SalMar reports metrics such as average production costs per kilogram and price achievement per kilogram, which together determine unit margins. While these figures can fluctuate with feed costs, regulatory requirements, and market demand, recent reporting indicated that price realization remained strong enough to offset cost pressures in many regions. The relationship between average achieved prices and cost per kilogram is a central determinant of EBIT per kilogram, a metric closely watched in the seafood sector.
Guidance and outlook metrics for 2024
For 2024, SalMar has communicated forward-looking harvest guidance that reflects its expectation for production volumes across its portfolio. The company’s outlook includes a targeted harvest volume that is broadly comparable to, or slightly above, the previous year, supporting expectations of continued scale. This guidance acts as a quantitative anchor for capacity planning, capital expenditure decisions, and revenue projections.
Management has also pointed to ongoing investment in farming technology, processing capacity, and sustainability-related initiatives as part of its long-term strategy. These investments are typically reflected in capital expenditure figures reported in financial statements and presentations, often running into significant NOK amounts over a multi-year horizon. For investors, the balance between capex and operating cash flow is crucial, because it shapes the company’s ability to maintain dividends, reduce debt, or fund further growth.
In recent reporting, SalMar outlined its expectations for market conditions, including salmon demand, price outlook, and regulatory developments. While the company does not control global pricing, its scale and cost position influence how changes in spot prices translate into earnings. Guidance often includes commentary on expected cost developments and regulatory costs, such as resource rent taxes in Norway, which can materially affect net profit and cash generation relative to prior years.
Dividend policy and shareholder returns
SalMar has a history of paying dividends, and recent financial reports indicate that the company has distributed cash to shareholders based on its earnings and financial position. The dividend per share announced for a recent fiscal year provides a concrete measure of shareholder returns and is directly comparable to the prior year’s dividend. Where the dividend has increased, it signals management confidence in the sustainability of earnings and cash flow; where it is stable or reduced, it reflects a more cautious stance or operational challenges.
The payout ratio, defined as dividend relative to net income, offers additional insight into how much of the company’s earnings are returned to shareholders versus retained for reinvestment. A comparison of payout ratios across fiscal years can show whether SalMar is moderating distributions in response to increased capital expenditure needs, regulatory uncertainty, or balance-sheet considerations. Investors often monitor this ratio alongside EPS and free cash flow per share as part of their assessment of total return potential.
In addition, SalMar’s market capitalization, expressed in Norwegian kroner, reflects the aggregate market assessment of its future earnings and cash flows. Changes in market capitalization over time, in combination with dividend distributions, contribute to total shareholder return. Comparing current market capitalization with prior-year levels provides a quantitative perspective on how the market has adjusted its valuation in response to operational and macroeconomic developments.
Product focus: farmed Atlantic salmon
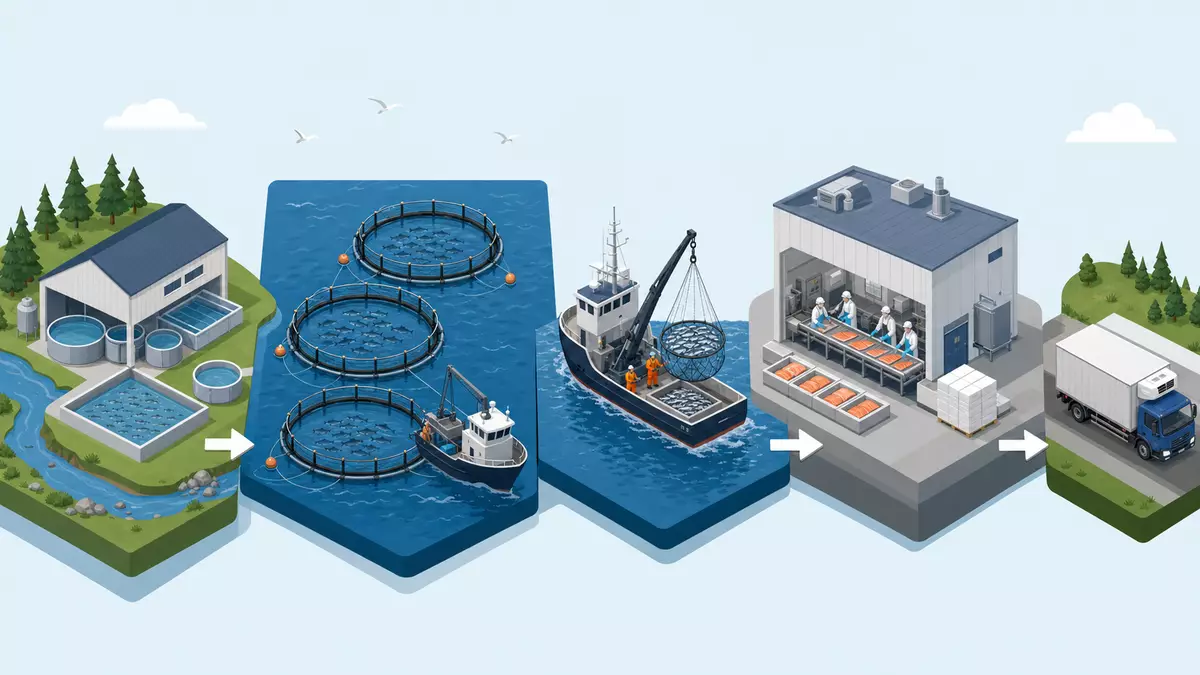
SalMar’s core product is farmed Atlantic salmon, which it produces, processes, and sells into global markets for fresh and frozen seafood. The product line includes whole fish and processed cuts, often sold under various brands and through retail, food service, and industrial customer channels. Revenue from salmon sales forms the bulk of the company’s operating income and is therefore central to understanding its financial performance.
Reported segment data often break down sales by region or product category, showing how demand in Europe, Asia, and other markets contributes to revenue. Volume and average price per kilogram data for Atlantic salmon provide a clear link between operational metrics and financial outcomes: higher volumes and prices translate into stronger revenue, while cost metrics determine margins. For investors, these quantified product-level metrics help to assess how changes in consumer demand, trade conditions, and competition may impact future earnings.
SalMar stock and trading context
SalMar stock is listed on the Oslo Stock Exchange under a Norwegian ticker symbol, and the shares are quoted in Norwegian kroner. The current share price trades within the range defined by its 52-week high and low, reflecting market perceptions of earnings risk, regulatory developments, and sector conditions. The relationship between the latest price level and the 52-week extremes offers a quantitative reference point for volatility and sentiment.
Over the year to date, SalMar’s share price performance can be measured as a percentage change from the opening level at the start of the year to the latest observed price. This year-to-date performance figure, expressed in percent, provides a clear comparison to both the prior year’s performance and to peers in the listed salmon farming sector. Where SalMar’s YTD percent change differs meaningfully from sector peers, it may highlight company-specific factors such as cost position, regulatory exposure, or balance sheet strength.
Average daily trading volume on the Oslo Stock Exchange, measured in number of shares, indicates the liquidity of SalMar stock. Liquidity matters for both retail and institutional investors, as it affects transaction costs and the ability to adjust positions. Comparing current average trading volume with prior quarter or prior year averages can show whether interest in the stock has increased or decreased in response to earnings releases, sector news, or macroeconomic developments.
More background on SalMar ASA
Investors can find detailed financial statements, harvest guidance, and sustainability information for SalMar ASA, including annual and quarterly reports, on dedicated company and regulatory pages.
Norwegian seafood sector comparison
Within the Norwegian seafood sector, SalMar stands alongside other large listed salmon farmers, and comparing key metrics such as harvest volumes, EBIT margins, and market capitalizations can help investors position the company among peers. For example, SalMar’s harvest guidance for the current year can be compared in metric tons to the guidance of other Norwegian producers, showing whether it is expanding faster, slower, or at a similar pace. Likewise, reported EBIT margins, expressed as a percentage of revenue, may be higher or lower than those of competitors, indicating differences in cost structure, biological performance, and market mix.
Sector-level data such as global salmon supply growth percentages and average spot price levels for Atlantic salmon offer additional context. When global supply grows more slowly than demand, prices tend to strengthen, benefitting producers like SalMar with lower cost bases. Conversely, rapid supply growth or regulatory constraints can pressure margins and limit harvest expansion. Quantified sector trends therefore form part of the analytical framework when assessing SalMar’s reported numbers and guidance.
Norwegian regulatory developments, including resource rent taxation and licensing rules, also play a role in sector valuation. Changes in tax rates or fee structures can be expressed in percent and affect net profit margins for all producers. By comparing how these changes affect SalMar’s reported and guided profit metrics versus peers, investors gain a clearer picture of relative exposure and resilience.
Balance sheet and financial structure
SalMar’s reported balance sheet includes total assets, total liabilities, and equity, providing insight into financial leverage and capital structure. Key metrics such as net interest bearing debt, often expressed in NOK billions, and the ratio of net debt to EBITDA, expressed as a multiple, help measure financial risk. Comparing net debt and leverage ratios between the latest reporting period and the prior year shows whether the company has increased or reduced leverage in response to market conditions and investment needs.
Liquidity metrics such as the current ratio, defined as current assets divided by current liabilities, offer a view of the company’s ability to meet short-term obligations. A ratio above one typically indicates a comfortable liquidity position, while lower ratios may prompt closer scrutiny. By tracking changes in these ratios over successive reporting periods, investors can see whether SalMar’s liquidity has strengthened or weakened.
Equity metrics such as book value per share, calculated as total equity divided by the number of shares outstanding, also form part of the valuation picture. Comparing book value per share between current and prior reporting periods shows how retained earnings and other equity movements have affected shareholder equity. In addition, the relationship between market price per share and book value per share, captured in the price-to-book ratio, offers a quantitative measure of how the market values the company’s assets.
Cost structure and efficiency metrics
The cost structure of salmon farming is complex, involving feed costs, smolt production, labor, maintenance, and regulatory expenses. SalMar reports cost per kilogram figures that reflect these inputs. Comparing current cost per kilogram with previous year levels shows how efficiency initiatives, feed price changes, and regulatory requirements have affected unit costs. A decrease in cost per kilogram relative to the prior year, in conjunction with stable or higher achieved prices, generally supports margin expansion.
Biological performance metrics such as survival rates, growth rates, and feed conversion ratios also influence costs and harvest volumes. Improvements in these metrics, reported in percentage terms, can lower unit costs and increase output. Where SalMar’s biological performance measures show year-over-year gains, it can directly translate into stronger EBIT per kilogram and overall profitability.
On the processing side, efficiency metrics such as throughput per hour and yield percentages in processing plants affect cost and revenue realization. Higher yields mean that more saleable product is obtained from each harvested fish, improving revenue per kilogram relative to cost. SalMar’s investments in processing technology and automation aim to enhance these metrics, and their evolution over time contributes to the company’s cost competitiveness.
Sustainability and regulatory metrics
Salmon farming is subject to environmental and sustainability scrutiny, and SalMar reports metrics such as emissions, energy use, and certifications. Quantified data, such as reductions in specific emissions per unit of output, expressed in percentage terms versus prior years, show how the company addresses environmental impact. Likewise, metrics on sustainable feed sourcing and certification coverage provide quantitative insight into sustainability performance.
Regulatory metrics such as compliance rates, expressed as percentages of sites meeting specific biological and environmental standards, are also reported. High compliance rates and improvements relative to prior periods can reduce regulatory risk and support license renewals or expansions. For a company like SalMar, maintaining strong regulatory metrics is critical, as non-compliance can lead to reduced allowed biomass or other sanctions, directly affecting harvest volumes and revenue.
Sustainability reporting often includes social metrics such as workplace safety statistics and diversity measures. Improvements in safety incident rates, reported as reductions in the number of incidents per thousand employees compared with prior years, indicate progress in occupational health and safety. These metrics, while not directly financial, contribute to broader ESG assessments that may influence institutional investor interest and valuations.
Analyst coverage and valuation metrics
SalMar is covered by financial analysts who publish estimates for revenue, EBITDA, EPS, and other metrics, along with valuation measures such as price targets and recommendation ratings. Consensus estimates for upcoming quarters or fiscal years, such as projected revenue and EPS figures, provide a quantitative benchmark against which actual results are compared. When SalMar reports revenue or EPS above or below consensus, the difference is often expressed in percentage terms, making it straightforward to see the magnitude of the beat or miss.
Valuation metrics such as forward price-to-earnings (P/E) and enterprise value to EBITDA (EV/EBITDA) ratios are widely used to compare SalMar with peers and historical averages. Comparing current forward P/E with the average over prior years can show whether the stock is trading at a premium or discount to its own history. Similarly, comparing current EV/EBITDA to sector averages provides a quantitative perspective on relative valuation in the salmon farming industry.
Analyst price targets, expressed in NOK per share, provide another reference point, although they are not recommendations for specific actions. The relationship between current market price and the average analyst price target, often expressed as a percentage difference, shows how much implied upside or downside analysts see relative to the latest price. These metrics, alongside fundamental figures, help investors frame expectations for future performance.
Risk metrics and scenario analysis
Risk analysis for SalMar involves quantifying exposure to biological risks, regulatory changes, price volatility, and financial leverage. Volatility metrics such as the standard deviation of daily returns and beta relative to a broader market index give numerical measures of share price fluctuation. Comparing these measures over different periods, such as one-year versus three-year windows, shows how risk has evolved over time.
Scenario analysis may use different assumptions for salmon prices, harvest volumes, and cost per kilogram to estimate potential impacts on revenue and EBIT. For example, a scenario in which salmon prices fall by a certain percentage relative to current levels can be used to estimate the resulting change in EBIT margin. Such quantified scenarios help illustrate the sensitivity of earnings to key variables.
Credit-related risk metrics, such as interest coverage ratios (EBIT divided by interest expense), provide insight into the company’s ability to service debt. Comparing interest coverage across reporting periods shows whether SalMar’s ability to meet financial obligations has strengthened or weakened. These quantified risk measures complement the fundamental and valuation metrics discussed earlier.
Summary of fundamentals and stock context
In summary, SalMar’s recent reporting and guidance provide a broad set of quantitative metrics that investors can use to analyze the stock. Revenue, EBIT, net income, harvest volumes, cost per kilogram, and dividend figures collectively describe the company’s operational and financial health. Comparisons to prior years or consensus estimates add depth, showing how performance is evolving over time.
For SalMar stock, the relationship between current price and historical ranges, combined with valuation ratios and analyst estimates, helps frame market expectations. Meanwhile, sustainability, regulatory, and risk metrics offer additional layers of insight beyond traditional financials. Together, these numbers form a comprehensive picture of SalMar’s position in the salmon farming sector and the factors that may influence future earnings and valuation.
SalMar ASA key data
- Company: SalMar ASA
- ISIN: NO0010310956
- Ticker: OSLO: SALM
- Trading venue: Oslo Stock Exchange
- Sector / Industry: Consumer Staples / Food Products (Seafood, Salmon Farming)
- Index membership: Noted in Norwegian equity indices
Disclaimer regarding our articles: No investment advice, no buy or sell recommendation. Information on prices, companies, and markets is provided without guarantee; changes are possible at any time. Stock market transactions can lead to substantial losses. Our articles are created and reviewed in whole or in part automatically with the support of AI.