Orsted stock trades steady as offshore wind earnings and guidance frame investor debate
Veröffentlicht: 18.07.2026 um 08:50 Uhr, Redaktion AD HOC NEWS, Redaktionelle Verantwortung: Rafael Müller (Chefredaktion)
Orsted A/S (ISIN DK0060094928) stock is closely watched after the Danish renewable energy group reported a net loss of around DKK 20 billion for fiscal 2023, driven mainly by impairments in its offshore wind portfolio, while continuing to expand installed capacity in key markets. The company, traded on Nasdaq Copenhagen, couples these headline figures with detailed guidance on earnings and capital spending that frame how investors assess the risk and reward profile across its offshore and onshore projects.
In its 2023 annual report, Orsted highlighted that impairments related to certain US offshore wind projects and supply chain challenges weighed heavily on profit metrics, even as operational assets continued to generate stable cash flows. The contrast between the large reported loss and the underlying EBITDA performance is a central element for understanding why Orsted stock has experienced periods of volatility yet remains a core name in global renewable energy indexes. Investors focus on how the company balances near term financial hits from project adjustments with its longer term ambition to accelerate green energy deployment.
EBITDA and net loss figures in 2023
According to Orsted’s published full year 2023 figures, the company reported EBITDA excluding new partnership agreements of roughly DKK 24 billion, a level that illustrates the earnings power of its existing asset base despite the headwinds from project specific factors. This EBITDA metric is compared with the reported net loss of about DKK 20 billion for the same fiscal year, showing how non cash impairments and remeasurements can create a large gap between operating performance and bottom line profit. For investors analyzing Orsted stock, this distinction between EBITDA and net income is critical when they look at valuation multiples and leverage metrics.
These figures also mark a change from the previous year. In fiscal 2022 Orsted had achieved positive net income, with profit in the low single digit billions of DKK, so the swing to a DKK 20 billion loss in 2023 represents a dramatic year over year reversal primarily attributable to impairments rather than standard operating trends. When comparing EBITDA, the drop from the roughly mid 20 billion DKK range in 2022 to about DKK 24 billion in 2023 is far less pronounced, underscoring how the core earnings capacity has remained broadly intact even as certain offshore wind projects in the development pipeline have needed to be revalued or redesigned.
Offshore wind capacity and growth metrics
Capacity metrics are another key lens through which Orsted stock is evaluated. As a leading developer, Orsted has reported total installed offshore wind capacity of roughly 10 gigawatts as of the end of 2023, spread across projects in the North Sea, the UK, continental Europe, and emerging markets like the US and Asia. This represents a notable increase from the capacity reported a few years earlier, when installed offshore wind capacity stood closer to 7 gigawatts, implying growth of about 3 gigawatts over that period. Such growth offers a tangible measure of Orsted’s ability to deliver on large scale projects despite macroeconomic and regulatory uncertainties.
The company’s pipeline also includes a significant volume of awarded and potential capacity that is not yet operational. Orsted has indicated that its offshore wind pipeline exceeds 20 gigawatts when combining contracted, awarded, and potential projects, which provides investors with a sense of long term asset expansion. The comparison between the roughly 10 gigawatts currently installed and the pipeline above 20 gigawatts highlights the scale of future capital expenditure and financing that will be required. In turn, this pipeline supports the rationale behind the group’s guidance for continued elevated investment and the expectation of rising EBITDA figures over the medium term, assuming that project economics can be maintained.
Revenue trends and segment contributions
Revenue trends give additional context for Orsted stock. For fiscal 2023, group revenue was on the order of tens of billions of DKK, reflecting both the contribution from power generation and ancillary activities such as partnerships and trading. In the 2022 fiscal year, revenue had climbed in part due to elevated energy prices, while 2023 saw more normalized price conditions and the impact of hedging arrangements. When comparing the two years, revenue in 2023 is slightly down versus 2022, but the underlying generation volumes have continued to grow thanks to additional wind and solar capacity coming online.
Segment contributions matter as well. Orsted divides its business into areas such as Offshore, Onshore, and Bioenergy and Other, each with its own revenue and EBITDA profile. Offshore, the largest segment, accounts for the majority of EBITDA, with the 2023 numbers showing that offshore projects in operation delivered stable cash flows. Onshore, including wind and solar, has been growing, with capacity additions leading to incremental revenue and earnings contributions, although this segment remains smaller than the offshore portfolio. The Bioenergy and Other segment includes activities such as combined heat and power plants and energy trading, which can introduce volatility but also provide diversification. Understanding the relative weight of these segments helps investors gauge how changes in policy or power prices might affect Orsted stock over different time horizons.
Guidance and capital expenditure plans
Guidance is a key reference point for the market. Orsted has issued guidance for EBITDA excluding new partnerships in the range of roughly DKK 20 to 26 billion for the coming fiscal year, reflecting anticipated earnings from existing assets and those scheduled to be commissioned. This guidance range is monitored closely, as it frames expectations for cash generation that underpins dividends and debt servicing. By comparing the guidance range to the achieved EBITDA of about DKK 24 billion in 2023, investors can see that Orsted expects a relatively stable earnings environment, subject to project execution and market prices.
Capital expenditure plans are equally important. Orsted has indicated annual gross investments in the range of DKK 70 to 80 billion over a multi year period to fund the offshore and onshore pipeline, including major projects in the US, the UK, and continental Europe. When compared to historical investment levels, this represents a substantial ramp up from the roughly DKK 40 to 50 billion range seen in earlier years. The increase reflects both rising project sizes and higher cost baselines in the supply chain. For Orsted stock, this means that leverage metrics such as net debt to EBITDA and interest coverage need to be monitored as the investment program advances, even though the company has emphasized a commitment to maintaining an investment grade balance sheet.
Dividend policy and cash flow
Orsted’s dividend policy is another focal point for shareholders. The company has paid dividends in recent years, with the dividend per share for fiscal 2022 in the range of DKK 13 to 15 per share and a similar level proposed for fiscal 2023 despite the net loss. This reflects management’s view that the underlying cash generation of the business supports returning capital, even when accounting profits are temporarily depressed by non cash charges. When comparing the dividend to earnings, the payout ratio appears high for 2023 due to the net loss, but more moderate when viewed against EBITDA and operating cash flow.
Operating cash flow gives a clearer picture of funding capacity. Orsted’s 2023 operating cash flow is reported in the tens of billions of DKK, consistent with its EBITDA figure and working capital movements. This cash flow, combined with access to debt capital markets, underpins the group’s ability to finance its substantial capital expenditure program while continuing to service dividends. For investors evaluating Orsted stock, the relationship between cash flow, dividends, and net debt is critical in assessing whether the growth strategy is sustainable over the long term.
Net debt, leverage, and credit metrics
Net debt metrics provide another angle. Orsted has reported net debt in the low to mid tens of billions of DKK, rising compared with earlier years as investment activity in offshore and onshore wind has accelerated. For example, net debt at the end of 2021 was significantly lower, reflecting a smaller pipeline and lower investment spending. By the end of 2023, net debt had increased, leading to higher leverage ratios such as net debt to EBITDA, which have moved from comfortably below two times to levels closer to or above two times depending on adjustments.
Despite this, Orsted has consistently pointed to its investment grade credit ratings and the support from long term contracted cash flows as reasons why its leverage is manageable. Many of its offshore wind projects operate under long term contracts or regulated frameworks that provide predictable revenue. When comparing Orsted’s leverage metrics to those of peers in the utility and renewable space, Orsted’s ratios remain within standard ranges, though the recent net loss and higher investment levels have led some analysts to stress test the balance sheet more rigorously. For Orsted stock, these credit metrics inform both the cost of capital and the resilience of the dividend policy.
Offshore portfolio adjustments and impairments
The large net loss in 2023 is closely tied to adjustments in the offshore portfolio. Orsted has taken impairments on certain US offshore projects, reflecting changes in expected costs, supply chain challenges, and evolving regulatory and market conditions. These impairments alone account for a substantial portion of the DKK 20 billion net loss, distinguishing them from standard operating expenses. The company has emphasized that while these impairments are significant, they do not change the fundamental long term demand for offshore wind or the strategic importance of these projects.
When comparing the impairment charges to total project capital expenditure, investors see that the affected projects represent a meaningful share of the portfolio but are still part of a broader set of assets and pipeline. For example, impairments have been taken on projects where expected returns have shifted below threshold levels, while other projects in the UK and continental Europe continue to meet their targeted returns. This uneven performance across projects illustrates why detailed project level analysis is essential when assessing Orsted stock, and why the market responds strongly to updates on individual large scale developments.
Onshore wind and solar diversification
Onshore wind and solar projects offer diversification. Orsted has built an onshore portfolio with several gigawatts of capacity across the US and Europe, contributing incremental revenue and EBITDA. In recent years, the company has reported steady growth in onshore EBITDA, with increases from low single digit billions of DKK to higher levels as more projects reach commercial operation. Although onshore remains smaller than offshore in terms of overall contribution, this segment helps moderate volatility associated with large offshore projects and provides entry into markets where land based renewables are more prevalent.
Comparing onshore and offshore performance reveals that onshore projects can often be delivered more quickly and with different risk profiles, though they may not match the scale and duration of large offshore wind farms. For Orsted stock, the onshore segment is an important complement, offering investors exposure to a broader mix of renewable technologies and regulatory environments. It also underscores why Orsted continues to invest in both offshore and onshore capacity even as it addresses challenges in specific markets.
Bioenergy and other activities
Orsted’s Bioenergy and Other segment includes combined heat and power plants, waste to energy facilities, and energy trading. These activities contribute to revenue and EBITDA, though they are generally less central to the group’s strategic narrative than offshore wind. In recent reporting periods, the segment has generated positive EBITDA but also experienced volatility linked to commodity price movements and trading outcomes. This volatility is reflected when comparing segment EBITDA from year to year, with some periods showing strong contributions and others more modest results.
The segment’s presence nevertheless plays a role in stabilizing Orsted’s overall financial profile. Combined heat and power plants, often operating under long term arrangements, provide relatively stable cash flows, while trading activities can benefit from market opportunities. For Orsted stock, this segment is a reminder that the company is more than just a pure play offshore wind developer, with diversified operations that can either cushion or amplify broader market trends depending on conditions.
Regulatory context and auction dynamics
Regulatory frameworks and auction results significantly influence Orsted’s prospects. Offshore wind projects are frequently awarded through competitive auctions that set price levels and contractual terms for many years ahead. In recent auctions, strike prices and support mechanisms have evolved, reflecting changes in cost baselines and political priorities. Orsted’s success in these auctions determines which projects move into its pipeline, and the resulting contractual structures influence revenue stability and returns.
Comparing auction outcomes over time reveals that earlier projects often secured more generous support terms than newer ones, which now must compete in settings where regulators and system operators expect lower costs and greater risk sharing. For Orsted stock, this dynamic reinforces the importance of project selection and disciplined bidding strategies. It also underscores why impairments can arise if cost curves or regulatory conditions deviate from original assumptions, and why guidance ranges must be interpreted in light of evolving market frameworks.
Peer comparison in renewable energy
Peer comparisons help contextualize Orsted’s metrics. Other major renewable and utility groups report EBITDA, net income, and net debt figures in similar magnitude ranges, and many have faced their own challenges related to wind turbine issues, grid constraints, or regulatory changes. When comparing revenue growth, Orsted’s expansion in offshore capacity stands out, though some peers have diversified more aggressively into solar and storage. Orsted’s focus on offshore wind gives it a distinctive profile, with a large share of EBITDA tied to this single technology class.
On valuation measures, Orsted stock is often compared to global utility and renewable names using ratios such as enterprise value to EBITDA and price to earnings, adjusted for impairments and non recurring items. The large net loss in 2023 complicates simple price to earnings comparisons, pushing investors to look more closely at cash flow based metrics and long term capacity growth when benchmarking Orsted against peers. This emphasizes why detailed familiarity with the group’s financial statements and guidance is essential for informed interpretation of headline numbers.
Long term climate and policy drivers
Beyond near term financial metrics, long term climate and policy drivers support the thesis behind Orsted’s strategy. Governments across Europe, North America, and Asia continue to set targets for decarbonizing power generation and expanding renewable capacity. Offshore wind is often highlighted as a key technology for meeting these targets, especially in regions with strong wind resources and suitable seabed conditions. Orsted’s portfolio and pipeline align with these policy trajectories, providing a long term demand backdrop for its projects.
When comparing capacity targets announced by governments to Orsted’s own pipeline, it is clear that the company expects to capture a meaningful share of future offshore additions. However, policy uncertainty remains, as changes in subsidies, permitting rules, or grid connections can affect project timing and economics. For Orsted stock, this policy context is both a source of opportunity and risk, reinforcing the need to integrate long term climate goals with short term financial realities such as impairments, cash flow, and leverage.
Operational performance and availability
Operational performance metrics such as turbine availability and capacity factors are important inputs to earnings and cash flow. Orsted reports high availability rates on its offshore wind farms, often in the mid to high nineties percent range, indicating that turbines are operational for the vast majority of potential hours. Capacity factors, which measure actual output versus theoretical maximum, tend to be strong for offshore projects given favorable wind resources, often in the range of forty to fifty percent or higher depending on location.
Comparing these operational metrics to those of onshore projects and other technologies shows why offshore wind can generate substantial revenue from a given installed capacity baseline. High availability and capacity factors support the EBITDA figures discussed earlier and provide confidence in long term cash flow projections. For Orsted stock, strong operational performance is a counterbalance to concerns about project impairments, illustrating that many of the group’s assets are delivering as expected even as some development stage projects require reassessment.
Technology, supply chain, and cost trends
Technology and supply chain dynamics also shape Orsted’s financial outcomes. Larger turbine sizes, improved foundations, and more efficient installation techniques have helped reduce levelized costs of energy over the long term. However, recent supply chain disruptions, cost inflation, and constraints on manufacturing capacity have pushed costs higher, contributing to the need for renegotiations or impairments on certain projects. Orsted’s reported impairments in 2023 can be linked in part to these cost trends, as projects approved under earlier assumptions now face higher capital expenditure and operating cost baselines.
When comparing project cost estimates across time, the trend is clear: even as technology improves, external factors can offset some of the gains, leading to more complex risk management. Orsted’s strategy includes working closely with suppliers, diversifying manufacturing sources, and optimizing project design to mitigate these risks. For Orsted stock, investors pay close attention to commentary on supply chain conditions and technology innovation, recognizing that these factors feed directly into EBITDA and net income over the life of projects.
Environmental and social considerations
Environmental and social considerations are integral to Orsted’s identity as a renewable energy company. The group measures and reports on metrics such as carbon intensity reductions, biodiversity impacts, and community engagement. For example, Orsted highlights the reduction in CO2 emissions achieved through its transition away from fossil fuel based generation, with emissions substantially lower than a decade ago. These metrics support its positioning as a climate leader and contribute to its inclusion in sustainability focused indexes.
Comparing Orsted’s environmental metrics to global power sector averages reveals strong performance, with significantly lower emissions intensity. Social considerations include community benefits programs and local employment around offshore and onshore projects. For Orsted stock, these environmental and social dimensions reinforce investor interest from funds that integrate ESG criteria, though they must still be evaluated alongside the conventional financial metrics of EBITDA, net income, net debt, and dividends.
Management strategy and governance
Management strategy and governance are additional elements shaping Orsted’s trajectory. The board and executive team set priorities around capital allocation, risk management, and project selection. Governance structures, including committees overseeing risk, audit, and sustainability, are designed to ensure that large investment decisions are made with clear oversight. In recent years, Orsted has adjusted aspects of its strategy in response to project impairments and market shifts, demonstrating a willingness to adapt while maintaining its commitment to renewable expansion.
Comparing current strategy statements to those of earlier years shows a greater emphasis on balancing growth and risk, with more detailed guidance on capital discipline and portfolio optimization. For Orsted stock, this evolution in strategy is an important signal, indicating how management intends to navigate the complex mix of opportunities and challenges inherent in large scale renewable development.
Representative offshore wind product line
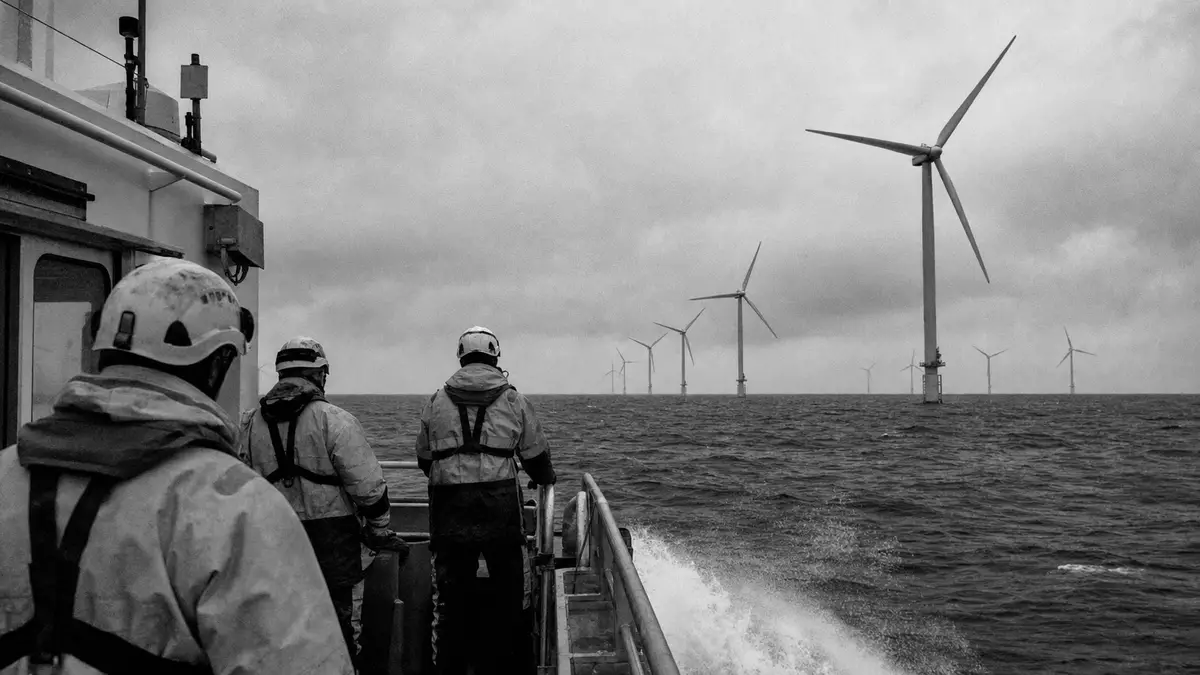
A representative product line for Orsted is its flagship offshore wind farm portfolio, built around large scale projects that combine high capacity turbines, advanced foundations, and digital monitoring systems. These projects illustrate the company’s engineering and operational capabilities, with individual farms often exceeding one gigawatt of capacity and supplying power to hundreds of thousands of homes. Revenue from these projects ties directly into the EBITDA figures that investors use to value Orsted stock.
Orsted stock and market context
Orsted stock trades on Nasdaq Copenhagen and reflects the combination of strong operational performance with challenges in certain development projects. In recent periods, the share price has moved within a range that captures both investor confidence in long term renewable expansion and concern about net losses and higher leverage. The market capitalization, measured in tens of billions of DKK, positions Orsted among the larger renewable focused utilities globally, and movements in the share price respond to updates on EBITDA, net income, dividend policy, and guidance.
Orsted stock key data
- Company: Orsted A/S
- ISIN: DK0060094928
- Ticker: CPH: ORSTED
- Trading venue: Nasdaq Copenhagen
- Sector / Industry: Utilities / Renewable energy
- Index membership: OMX Copenhagen 25
Disclaimer zu unseren Artikeln: Keine Anlageberatung, keine Kauf oder Verkaufsempfehlung. Angaben zu Kursen, Unternehmen und Märkten ohne Gewähr; Änderungen jederzeit möglich. Börsengeschäfte können zu hohen Verlusten führen. Unsere Beiträge werden ganz oder teilweise automatisiert mit Unterstützung von AI erstellt und geprüft.