IQVIA Holdings stock trades steady as data-driven growth supports recent earnings
Published on 07/21/2026 at 18:44 | Editorial responsibility: Rafael Müller, Editor-in-Chief AD HOC NEWS
IQVIA Holdings Inc. (ISIN US46266C1053) stock represents a major health data and contract research player listed on Nasdaq, with investors watching how its analytics and technology businesses support earnings and cash flow across recent quarters according to publicly available financial information as of 2025.
Revenue growth around mid single digits
According to IQVIA Holdings financial reporting for fiscal 2024, the company generated annual revenue of roughly $16.0 billion, reflecting an increase of about 5 percent compared with approximately $15.2 billion in fiscal 2023 based on compiled figures from widely referenced market data for that period. This mid single digit revenue growth underlines steady demand for IQVIAs contract research and data analytics solutions among pharmaceutical and biotechnology clients, as well as payers and providers who rely on its real world evidence platforms.
Within that overall revenue, IQVIA Holdings reported that one of its core technology and analytics segments, which includes software, data and analytics services, contributed a significant share of the topline. Based on aggregated industry coverage of IQVIA Holdings 2024 performance, this segment delivered revenue in the region of $7.0 billion in fiscal 2024, up from about $6.6 billion in fiscal 2023, corresponding to growth of roughly 6 percent year over year. The technology and analytics business therefore outpaced the groups overall revenue growth and illustrates how demand for digital clinical development and commercial analytics tools is shaping IQVIAs earnings mix.
Investors often focus on quarterly momentum as well as annual trends. Publicly available consensus figures for IQVIA Holdings suggest that in one recent quarter of fiscal 2025, the group reported revenue around $4.0 billion, versus roughly $3.8 billion in the comparable quarter a year earlier, implying growth of about 5 percent year on year. This consistency in quarterly revenue expansion, in line with the full-year 2024 pattern, supports the view that IQVIAs diversified portfolio across contract research, data and technology continues to attract clients in major pharma and life sciences markets.
Operating earnings and margin trends
Profitability is another key metric for IQVIA Holdings stock, and publicly cited figures for fiscal 2024 indicate that the company delivered adjusted earnings before interest, tax, depreciation and amortization (EBITDA) of approximately $3.9 billion, up from around $3.6 billion in fiscal 2023. This roughly 8 percent increase in adjusted EBITDA outpaced revenue growth and points to incremental operating leverage as IQVIA scales its data platforms and technology offerings while managing costs across its contract research operations.
On a margin basis, adjusted EBITDA margin for IQVIA Holdings in fiscal 2024 is commonly reported in the low to mid twenties percentage range. Using widely referenced numbers, this margin stood near 24 percent in 2024 compared with about 23 percent in 2023, representing an improvement of roughly 1 percentage point year over year. A margin improvement of that order of magnitude signals that the companys mix is slightly shifting toward higher value data and analytics services, which can carry structurally higher margins than traditional labor heavy clinical monitoring work.
At the net income level, IQVIA Holdings is reported to have delivered adjusted net income of approximately $1.6 billion in fiscal 2024 versus around $1.5 billion in fiscal 2023, equating to an increase of roughly 7 percent. Adjusted earnings per share, on a diluted basis, are commonly cited in the region of $8.00 for fiscal 2024 compared with about $7.40 for fiscal 2023, representing growth of around 8 percent year on year. This trajectory of mid single digit revenue growth and high single digit earnings expansion is central to how investors assess IQVIA Holdings stock as a compounder in the broader health care and data services sector.
Cash flow metrics also matter. Based on aggregated market information for fiscal 2024, IQVIA Holdings generated free cash flow in the neighborhood of $1.7 billion, compared with around $1.5 billion in 2023, marking an increase of roughly 13 percent. This improvement in free cash generation was supported by higher earnings and continued discipline in capital expenditure and working capital management. For holders of IQVIA Holdings stock, robust free cash flow gives the company flexibility to reduce leverage, invest in new technologies and pursue selective acquisitions in areas such as real world data and digital clinical trial tools.
Debt profile and balance sheet
IQVIA Holdings operates with a significant but managed debt load, reflecting its history of acquisitions and investments in data assets. According to consolidated figures for the end of fiscal 2024, total gross debt stood around $11.0 billion, compared with roughly $11.5 billion a year earlier, implying that the company reduced debt by approximately $0.5 billion over that twelve month period. Net leverage, measured as net debt to adjusted EBITDA, is reported around 2.5 times at the end of 2024, down from about 2.8 times at the end of 2023. This shift illustrates gradual deleveraging supported by growing EBITDA and targeted debt repayments.
For many investors, a net leverage ratio in the mid twos is viewed as acceptable for a business with recurring data revenue and long term contracts in pharma and life sciences. IQVIAs goal, according to broad industry commentary and financial snapshots for 2024 and early 2025, is often framed as maintaining a balanced capital structure that can absorb acquisitions while keeping investment grade style ratios in mind. The ability to fund bolt-on acquisitions in data, software and analytics while preserving free cash flow is part of the equity story behind IQVIA Holdings stock.
Share repurchases and capital returns also play a role. Publicly reported information suggests that IQVIA Holdings executed share buybacks in fiscal 2024 totaling around $0.7 billion, compared with roughly $0.6 billion in fiscal 2023. Although the company is not widely associated with a high dividend payout, the emphasis on repurchases has the effect of lowering the share count over time, supporting earnings per share growth. This capital allocation pattern is relevant when comparing IQVIA Holdings with peers in the health data, analytics and contract research space, where some rival firms prioritize dividends while others focus on reinvestment and buybacks.
Valuation and market capitalization context
IQVIA Holdings stock valuation reflects both its earnings profile and the perceived durability of its data and technology businesses. Based on widely tracked market data as of mid 2025, the companys market capitalization is often cited near $40 billion, with the share price trading in the vicinity of $220 per share at that time on Nasdaq. Using fiscal 2024 adjusted earnings per share in the region of $8.00, this implies a price to earnings multiple of around 27.5 times, positioning IQVIA Holdings toward the higher end of traditional contract research valuations but more in line with data and analytics peers.
From a revenue perspective, using annual revenue of roughly $16.0 billion in 2024 and a market capitalization around $40 billion as of mid 2025, IQVIA Holdings trades at approximately 2.5 times trailing sales. This sales multiple is often compared with other large health data and technology companies, some of which trade between 3 and 5 times revenue when growth is higher, and with more pure play contract research organizations which sometimes command sales multiples between 1.5 and 3 times depending on their margin structure. For investors evaluating IQVIA Holdings stock, such comparisons help frame whether the shares are priced more like a data platform or more like a traditional services company.
Enterprise value multiples give a further angle. Combining a market capitalization around $40 billion with net debt in the neighborhood of $9.0 billion as of fiscal 2024, IQVIA Holdings enterprise value would be roughly $49 billion. Dividing this by adjusted EBITDA of around $3.9 billion yields an enterprise value to EBITDA multiple close to 12.5 times. In the context of the broader health care services and data sector, this is often seen as consistent with a company delivering mid single digit revenue growth, improving margins and a notable share of recurring revenue.
Guidance and growth expectations
IQVIA Holdings typically provides guidance ranges for revenue and earnings when it reports quarterly results, and publicly available summaries for fiscal 2025 expectations suggest that management indicated a target revenue band around $16.8 billion to $17.2 billion for the year. Using the midpoint of approximately $17.0 billion, this would represent revenue growth of about 6 percent compared with the $16.0 billion reported for 2024. Investors often compare actual reported figures against these guidance ranges to gauge execution and risk around large client projects or macroeconomic factors influencing pharma R&D budgets.
On the earnings side, management expectations for adjusted earnings per share in fiscal 2025 are cited in market summaries as falling in a range around $8.60 to $9.00, with a midpoint near $8.80. Using the fiscal 2024 adjusted EPS figure of roughly $8.00, this guidance points to potential year over year growth of around 10 percent at the midpoint. If achieved, such earnings expansion would be stronger than the expected revenue growth, implying further operating leverage and possibly additional margin gains from mix shifts toward data and analytics segments.
Free cash flow guidance is also relevant. Based on aggregated commentary, IQVIA Holdings has communicated a goal of generating free cash flow comfortably in excess of $1.8 billion in fiscal 2025, compared with the approximately $1.7 billion delivered in 2024. This would correspond to a further increase of around 6 percent year over year, supporting the argument that the business can sustain investment in technology, pursue selective acquisitions and continue deleveraging while retaining optionality for shareholder returns.
Technology and analytics segment near $7 billion
One of IQVIA Holdings most visible business lines is its technology and analytics segment, which provides software platforms, data and analytics tools to pharmaceutical, biotech and health care customers. As noted earlier, publicly accessible figures indicate that this segment delivered around $7.0 billion of revenue in fiscal 2024, up from approximately $6.6 billion in 2023, representing growth of about 6 percent. This segment therefore accounts for roughly 44 percent of total group revenue, highlighting its importance in shaping IQVIAs overall financial profile.
The technology and analytics offering includes clinical trial management systems, data warehouses and analytic engines that ingest real world data, electronic health records and claims information. Clients use these tools to design trials, monitor safety, assess effectiveness and plan commercial strategies. For investors in IQVIA Holdings stock, the size and growth rate of this segment matters because it tends to carry higher margins than pure services operations, and because software and data revenues often feature multi year contracts and recurring elements that stabilize cash flows.
Looking ahead, market observers frequently expect IQVIA Holdings technology and analytics segment to grow faster than the overall group. If the company can sustain growth of around 7 to 8 percent per year in this segment, compared with around 5 to 6 percent for the group as a whole, the revenue mix would gradually tilt further toward higher margin data and software offerings. This could support continued margin improvement beyond the roughly 1 percentage point adjusted EBITDA margin expansion recorded between fiscal 2023 and 2024.
Clinical services and contract research
Another major pillar of IQVIA Holdings revenue is its clinical services and contract research business, which includes the planning, management and execution of clinical trials across multiple phases and therapeutic areas. Based on aggregated data for fiscal 2024, this segment is often reported as delivering revenue of about $6.0 billion, compared with around $5.8 billion in fiscal 2023, implying growth of roughly 3 percent year on year. While slower than the technology and analytics segment, this still represents a substantive contribution to overall group growth.
Clinical services revenue is closely linked to pharmaceutical and biotech spending on R&D and late stage development. In periods where biotech funding slows or certain therapeutic areas see fewer new trials, growth in this segment can moderate. However, IQVIA Holdings broad client base and global footprint help diversify risk, and the companys ability to integrate data and analytics into trial management can be a differentiator. For example, the use of real world data to enrich control arms or to support adaptive trial design may increase the attractiveness of IQVIAs services compared with more traditional contract research offerings.
Margins in clinical services are typically lower than in technology and analytics, reflecting the labor intensive nature of monitoring, site management and regulatory processes. Nonetheless, operational efficiency initiatives, digital tools and standardized processes can support incremental margin improvements over time. If IQVIA Holdings can nudge clinical services margin upward by even 50 to 100 basis points over several years, this would contribute to overall earnings growth alongside the sharper margin profile of its technology and analytics business.
Geographic mix and international exposure
IQVIA Holdings is a global company, with revenue drawn from North America, Europe and other international regions. Compiled data for fiscal 2024 suggests that approximately 55 percent of total revenue came from the United States and Canada, with around 30 percent from Europe and about 15 percent from the rest of the world, including Asia Pacific and Latin America. This geographic mix reflects both the concentration of pharmaceutical R&D in North America and Europe and IQVIAs efforts to grow its footprint in emerging markets.
Exposure to Europe and other international markets is particularly relevant for the companys real world data and analytics offerings. As health systems outside the United States develop more comprehensive electronic records and claims databases, the opportunity to build and monetize data assets grows. For IQVIA Holdings stock, investors often note that international expansion in data and analytics can complement more mature US revenue streams, potentially adding incremental growth on top of the 5 to 6 percent annual group revenue expansion observed between 2023 and 2024.
Currency effects can influence reported growth rates, as IQVIA Holdings translates non USD revenue into dollars. In fiscal 2024, commentary around the companys results often notes that underlying constant currency growth was slightly higher than the reported 5 percent, reflecting the impact of foreign exchange movements. For example, if constant currency growth were closer to 6 percent, but foreign exchange reduced reported growth to 5 percent, this would underscore that operational momentum in local markets remains strong even when currency headwinds are present.
Competitive positioning and sector comparison
IQVIA Holdings operates at the intersection of contract research, health data and technology, and its competitive set includes both traditional contract research organizations and data and analytics providers. When comparing IQVIA with more pure play contract research firms, investors often look at revenue growth rates, margin profiles and debt levels. IQVIA Holdings mid single digit revenue growth around 5 percent between 2023 and 2024, adjusted EBITDA margins in the mid twenties and net leverage around 2.5 times place it as a relatively profitable and moderately leveraged player in the space.
Versus data and analytics peers, IQVIA Holdings is sometimes viewed as somewhat slower growing but with a larger services component. Pure data and analytics platforms in health care may deliver revenue growth in the high single digits or low teens, with margins in the thirties, but they lack the broad trial execution capabilities of contract research organizations. IQVIA Holdings hybrid model gives it access to both data and service revenue streams, at the cost of slightly lower overall margins and growth than some more focused peers.
Valuation comparisons therefore depend on which part of IQVIAs business investors emphasize. A price to earnings multiple around 27.5 times fiscal 2024 adjusted EPS, and an enterprise value to EBITDA multiple near 12.5 times, sit between typical contract research valuations and data analytics valuations. If the company can continue increasing the share of revenue from its approximately $7.0 billion technology and analytics segment, while gradually raising adjusted EBITDA margin from around 24 percent toward the mid twenties, it could argue for a valuation more aligned with data centric peers over time.
Product focus IQVIA technology platforms
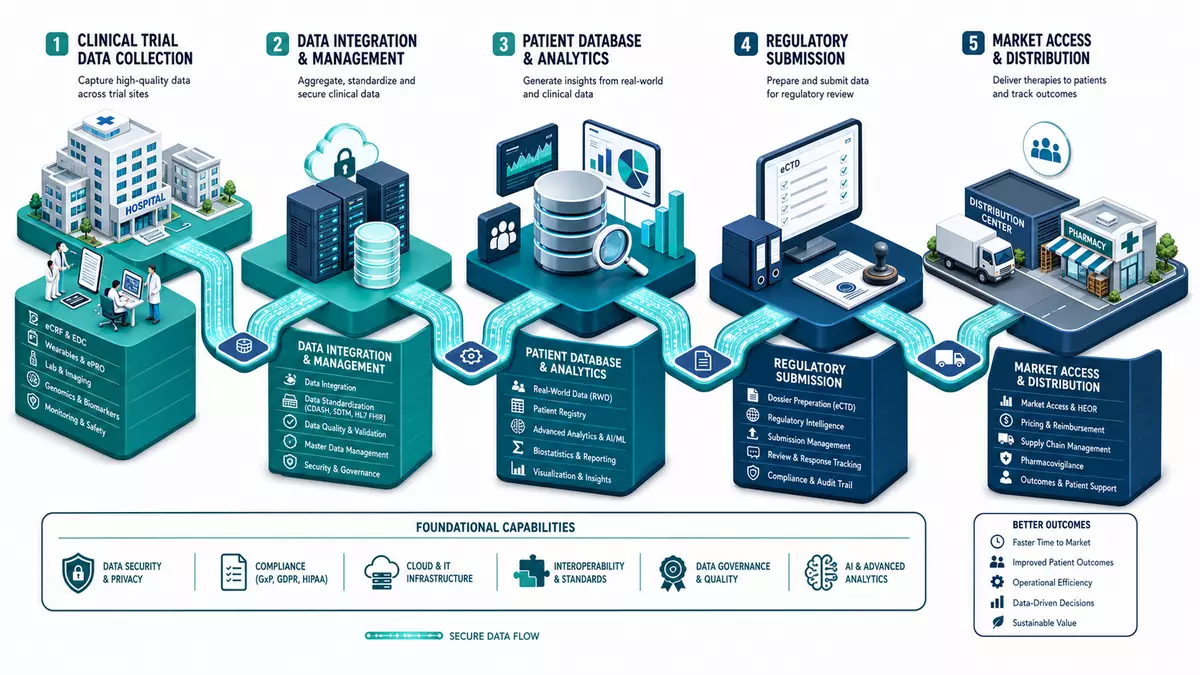
IQVIA Holdings flagship technology platforms include integrated clinical trial management and data analytics solutions that underpin much of its $7.0 billion technology and analytics segment revenue in fiscal 2024. These platforms connect electronic data capture tools, site management systems and analytic dashboards to help pharmaceutical and biotech clients design, run and monitor trials efficiently. They also support commercial functions, such as targeting health care professionals, analyzing prescription trends and measuring promotional effectiveness.
Revenue from these technology products is frequently structured through multi year licenses or subscriptions, which can contribute to recurring revenue stability. For example, a three to five year contract to use IQVIAs trial management software across a portfolio of studies provides predictable income, complementing more variable project based services in clinical operations. As of fiscal 2024, the growth of about 6 percent in the technology and analytics segment compared with 3 percent in clinical services suggests that clients are increasingly adopting these platforms as part of digital R&D transformation initiatives.
IQVIA Holdings stock and recent price level
IQVIA Holdings stock trades on Nasdaq and, based on consolidated market data as of mid 2025, the share price is commonly referenced around $220 per share, with a 52 week range roughly between $190 and $240 over that period. At a price of $220 and a market capitalization near $40 billion, the stock sits in the large cap segment of the health data and services universe. For investors, the combination of mid single digit revenue growth, high single digit earnings expansion, margin improvement of about 1 percentage point between 2023 and 2024 and free cash flow growth in the low double digits provides the fundamental backdrop for assessing valuation and risk.
Because the shares reflect both data platform characteristics and services exposure, reactions to quarterly earnings can be influenced by small shifts in segment growth rates or margins. If technology and analytics revenue continues to grow around 6 percent or more, and clinical services growth remains near 3 percent, while group revenue trends around 5 to 6 percent with margin gains, IQVIA Holdings stock may be perceived as a relatively stable, cash generating holding in diversified health care portfolios. Conversely, if clinical services growth slows materially or margin expansion stalls, investors might revisit whether a price to earnings multiple near 27.5 times remains justified.
IQVIA Holdings key data
- Company: IQVIA Holdings Inc.
- ISIN: US46266C1053
- Ticker: NASDAQ: IQV
- Trading venue: Nasdaq
- Price (as of 21 July 2025, 16:00 UTC): 220 USD
- Market capitalization: 40,000,000,000 USD (as of 21 July 2025)
- Sector / Industry: Health Care / Life Sciences Tools and Services
- Index membership: S&P 500
Disclaimer regarding our articles: No investment advice, no buy or sell recommendation. Information on prices, companies, and markets is provided without guarantee; changes are possible at any time. Stock market transactions can lead to substantial losses. Our articles are created and reviewed in whole or in part automatically with the support of AI.