
Capgemini SE Stock (FR0000125338): Technical pressure mounts after 30% year-to-date slide
Published on 06/14/2026 at 22:56 | Editorial responsibility: Rafael Müller, Editor-in-Chief AD HOC NEWS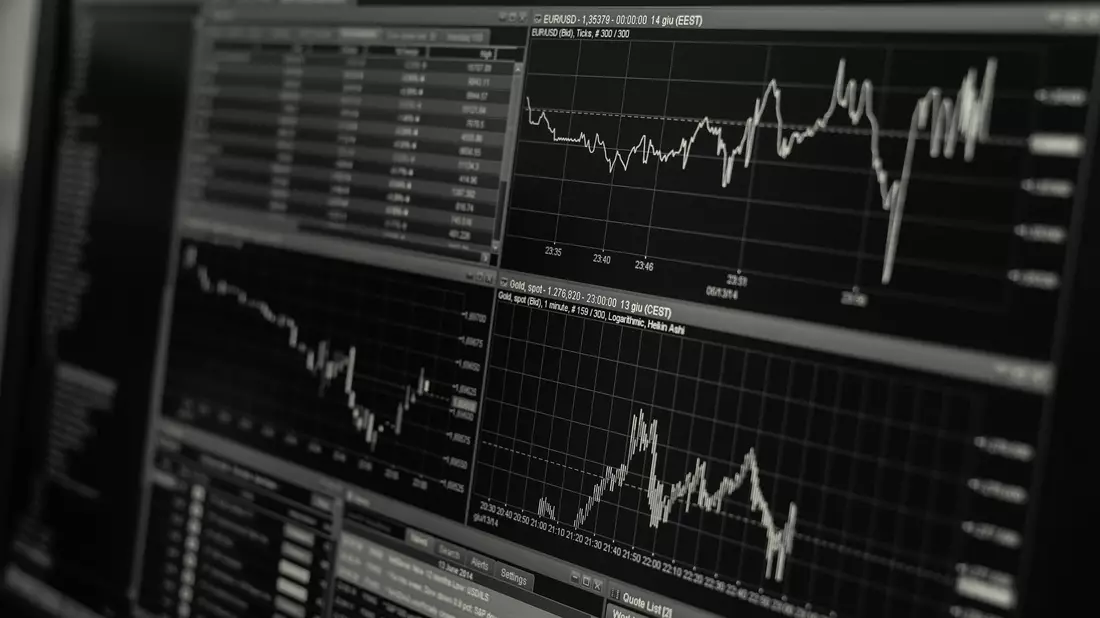
Responsible: ad hoc news Technical Analysis Desk. Reviewed prior to publication on June 14, 2026 at 10:55 PM ET. Details in the imprint.
Capgemini SE remains under notable chart pressure, with the stock reportedly down a bit more than 30% since the beginning of 2026 and trading clearly below its 200-day moving average, according to recent technical commentary from IT-Boltwise and other market reports. As of the latest available close cited in those analyses, the shares traded in the mid-90 euro range, near their year low, which keeps the French IT and consulting group in focus for technically oriented investors. While the broader CAC 40 index has delivered a modest positive performance over the past year, Capgemini has significantly lagged that benchmark, underlining how stock-specific concerns have overshadowed the supportive index backdrop. With the next earnings update expected in July, the current price zone around recent support levels has become a key area to watch for signs of either stabilization or further downside pressure.
Technical picture: downtrend and key levels under scrutiny
Recent technical assessments describe Capgemini SE as being in a clear downtrend, with the price having moved decisively below its longer-term moving averages and failing so far to regain those reference lines. IT-Boltwise and Boerse-Express highlight that, based on early June data, the share price has lost roughly 31% to 32% year-to-date, a decline that brought the stock close to its 52-week low and reinforced the negative trend structure on the chart. In that context, resistance levels above the market have hardened, as previous support zones broken during the sell-off can act as overhead barriers when the stock attempts to rebound.
Boerse-Express reports that the stock most recently closed at about EUR 96.60, which is not far from a highlighted support area around EUR 96 that traders are watching for potential downside tests. A sustained break below that region, if it occurs on higher volume, would likely be interpreted by chart technicians as a continuation signal of the existing downtrend and could open the way toward new year lows. Conversely, successful defense of that area followed by a move back above short-term moving averages could indicate at least a temporary relief phase inside the broader negative pattern, even if the longer-term trend remains under pressure.
Technical commentary also emphasizes the role of the 200-day moving average as a key long-term trend indicator that currently sits well above the latest trading range. With the share price clearly below this line, the prevailing interpretation is that the primary trend remains negative until the stock can regain and hold that moving average for a sustained period. Shorter-term averages, such as 50-day references where reported, have likewise tended to roll over, signaling that medium-term momentum has aligned with the broader downside direction.
In addition to moving averages and static support levels, some technical observers are likely monitoring momentum indicators such as the Relative Strength Index (RSI) to gauge whether the stock is oversold or merely trending lower in a controlled fashion. Although specific RSI values for Capgemini are not cited in the available reports, the magnitude of the year-to-date loss and the proximity to the yearly low indicate that the stock has been under persistent selling pressure rather than experiencing a brief corrective setback. In such settings, even an oversold reading does not guarantee a durable reversal, but it can herald phases where short-covering or bargain-hunting triggers countertrend bounces within a broader downtrend.
From a pattern perspective, the sustained sequence of lower highs and lower lows described in chart analyses points to a classic bearish structure. Each attempted recovery has so far stalled below the prior local peak, suggesting that sellers continue to use rallies as opportunities to exit or reduce positions instead of allowing a base-building process to unfold. If this pattern persists into the upcoming earnings release, the stock could be vulnerable to further volatility around that event, particularly if the fundamental news does not provide a clear catalyst for a shift in sentiment.
Compared with the CAC 40 index, which has recorded a roughly positive single-digit percent performance over the past 12 months and sits only a few percent below its 52-week high, Capgemini’s underperformance stands out. The divergence indicates that sector- or company-specific factors, rather than broad market weakness, have weighed on the shares over recent months. For technically oriented market participants, this underperformance relative to a relevant benchmark is often seen as confirmation that the stock remains in a weaker position than the wider French large-cap universe, at least until the price action can demonstrably improve.
Volatility conditions also play a role in how traders interpret the current chart setup. A stock trading near its year low after a 30%-plus decline can either enter a consolidation phase, where price swings narrow and a new equilibrium is sought, or remain subject to sharp moves if liquidity thins out and news flow intensifies. The upcoming quarterly results window in July, mentioned in technical commentary, can therefore act as a potential volatility event, as any new guidance or margin commentary could either reinforce the entrenched negative trend or provide a narrative for a reversal attempt.
In this environment, trading strategies around Capgemini tend to focus on clearly defined levels rather than long-term projections, with support near the recent lows and resistance around prior breakdown zones serving as central reference points. Short-term traders may look for momentum signals as the price approaches those levels, while longer-horizon investors who incorporate charts into their process may prefer to wait for confirmation that the downtrend is at least slowing, such as a series of higher lows or a decisive recapture of key moving averages. Because technical setups can shift quickly when fresh fundamental information arrives, the coming earnings update is likely to be watched closely by participants who have been tracking the stock’s pronounced slide since the start of the year.
Against this backdrop, the main question for market observers is whether Capgemini shares will continue to follow the current downward trajectory or begin carving out a base as the next earnings release draws nearer. The answer will depend not only on the company’s upcoming numbers and outlook but also on how investors weigh those fundamentals against the already steep year-to-date decline and the present chart configuration. For now, Capgemini remains a technically driven story, with its position below the 200-day moving average and near key support zones shaping much of the short-term narrative.
Capgemini SE at a glance
- Name: Capgemini SE
- Industry: IT services and consulting
- Headquarters: Paris, France
- Core markets: Europe, North America, Asia-Pacific
- Revenue drivers: Consulting, application services, cloud and infrastructure services, digital transformation projects
- Listing: Euronext Paris, ticker CAP
- Trading currency: Euro (EUR)
Follow Capgemini SE for further updates
Stay on top of future developments, including upcoming earnings and any changes in the technical picture, with our ongoing coverage of Capgemini SE.
More Capgemini SE newsInvestor RelationsThis article was created with a.i. assistance and editorially reviewed. Not investment advice, not a buy or sell recommendation. Trading in securities carries risks up to the total loss of capital.
Disclaimer regarding our articles: No investment advice, no buy or sell recommendation. Information on prices, companies, and markets is provided without guarantee; changes are possible at any time. Stock market transactions can lead to substantial losses. Our articles are created and reviewed in whole or in part automatically with the support of AI.