
AB InBev Reports Full Year and Fourth Quarter 2023 Results
Published on 02/29/2024 at 07:10 | businesswireindia.comAB InBev (Brussel:ABI) (BMV:ANB) (JSE:ANH) (NYSE:BUD):
This press release features multimedia. View the full release here: https://www.businesswire.com/news/home/20240228688664/en/
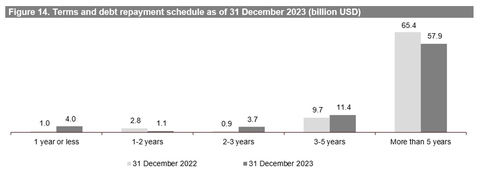
Figure 14. Terms and debt repayment schedule as of 31 December 2023 (billion USD) (Graphic: Business Wire)
Regulated and inside information1
“Our business delivered another year of consistent profitable growth with a revenue increase of 7.8% and EBITDA growth of 7.0%. Strong free cash flow generation enabled us to progress on our deleveraging, propose an increased dividend to our shareholders and execute on a 1 billion USD share buyback. Our results are a testament to the strength of the beer category, resilience of our business and people, consistent execution of our replicable growth drivers and our unwavering commitment to invest for long-term growth and value creation.” – Michel Doukeris, CEO, AB InBev
|
Total Revenue 4Q +6.2% | FY + 7.8% Revenue increased by 6.2% in 4Q23 with revenue per hl growth of 9.3% and by 7.8% in FY23 with revenue per hl growth of 9.9%. in combined revenues of our global brands, Budweiser, Stella Artois, Corona and Michelob Ultra, outside of their respective home markets in 4Q23, and 18.2% in FY23.
Approximately 70%of our revenue through B2B digital platforms with the monthly active user base of BEES reaching 3.7 million users.
Over 550 million USDof revenue generated by our digital direct-to-consumer ecosystem.
Total Volume 4Q - 2.6% | FY - 1.7% In 4Q23, total volumes declined by 2.6% , with own beer volumes down by 3.6% and non-beer volumes up by 3.0%. In FY23, total volumes declined by 1.7% with own beer volumes down by 2.3% and non-beer volumes up by 2.1%.
Normalized EBITDA 4Q + 6.2% | FY +7.0% In 4Q23, normalized EBITDA increased by 6.2% to 4 877 million USD with a normalized EBITDA margin contraction of 2 bps to 33.7%.In FY23, normalized EBITDA increased by 7.0% to 19 976 million USD and normalized EBITDA margin contracted by 23 bps to 33.6% . Normalized EBITDA figures of FY23 and FY22 include an impact of 44 million USD and 201 million USD, respectively, from tax credits in Brazil. |
Underlying Profit (million USD) 4Q 1 661 | FY 6 158 Underlying profit (profit attributable to equity holders of AB InBev excluding non-underlying items and the impact of hyperinflation) was 1 661 million USD in 4Q23 compared to 1 739 million USD in 4Q22 and was 6 158 million USD in FY23 compared to 6 093 million USD in FY22.
Underlying EPS (USD) 4Q 0.82 | FY 3.05 Underlying EPS was 0.82 USD in 4Q23, a decrease from 0.86 USD in 4Q22 and was 3.05 USD in FY23, an increase from 3.03 USD in FY22.
Net Debt to EBITDA 3.38x Net debt to normalized EBITDA ratio was 3.38x at 31 December 2023, compared to 3.51x at 31 December 2022.
Capital Allocation Dividend 0.82 EUR The AB InBev Board proposes a full year 2023 dividend of 0.82 EUR per share, subject to shareholder approval at the AGM on 24 April 2024. A timeline showing the ex-dividend, record and payment dates can be found on page 16.
Out of the one billion USD share buyback program announced on 31 October 2023, 870 million USD was completed as of 23 February 2024. |
The 2023 Full Year Financial Report is available on our website at www.ab-inbev.com.
|
1The enclosed information constitutes inside information as defined in Regulation (EU) No 596/2014 of the European Parliament and of the Council of 16 April 2014 on market abuse, and regulated information as defined in the Belgian Royal Decree of 14 November 2007 regarding the duties of issuers of financial instruments which have been admitted for trading on a regulated market. For important disclaimers and notes on the basis of preparation, please refer to page 17. |
Management comments
Creating a future with more cheers
Our business delivered another year of consistent profitable growth, with an EBITDA increase of 7.0%, in-line with our medium-term growth ambition and outlook for the year. While our full growth potential was constrained by the performance of our US business, we remained true to our purpose and laser focused on the execution of our strategy.
We made disciplined revenue management and resource allocation choices, delivering broad-based growth with top- and bottom-line increases in four of our five operating regions. Our results are a testament to the strength of the beer category, resilience of our business and people, consistent execution of our replicable growth drivers and our unwavering commitment to invest for long-term growth and value creation.
As with any year, there was success to celebrate and challenges from which to learn. We are taking the learnings and moving forward in a stronger position to realize our full growth potential.
Delivering consistent profitable growth
Our top-line increased by 7.8% in FY23, with revenue growth in more than 85% of our markets, driven by a revenue per hl increase of 9.9% as a result of pricing actions, ongoing premiumization and other revenue management initiatives. Volumes declined by 1.7% as growth in many of our emerging and developing markets was primarily offset by performance in the US and a soft industry in Europe.
EBITDA increased by 7.0%, with our top-line growth partially offset by anticipated transactional FX and commodity cost headwinds and increased sales and marketing investments. Underlying EPS was 3.05 USD, an increase of 0.02 USD per share versus FY22.
Progressing our strategic priorities
- Lead and grow the category
We remain focused on the consistent execution of our five proven and replicable category expansion levers. In FY23, the beer and beyond beer category continued to gain share of alcohol by volume globally, led by gains in South America and China, according to Euromonitor.
We focused our investments behind the megabrands in our portfolio that are driving the majority of our growth and the global mega platforms that consumers love and that bring people together. Our portfolio of brands is unparalleled, with 7 out of the top 10 most valuable beer brands in the world, according to Kantar BrandZ, and 20 iconic billion-dollar revenue beer brands. The combination of our iconic brands with mega platforms such as the Olympics, FIFA World CupTM, Copa America, NFL, UFC, NBA, Lollapalooza and Tomorrowland has us uniquely positioned to lead and grow the category.
The relevance, authenticity and effective creativity of our marketing work continues to be recognized. At the 2023 Cannes Lions International Festival of Creativity, campaigns and brands from all 5 of our operating regions were awarded and we were honored to be named as the Creative Marketer of the Year for the second year in a row.- Category Participation: In FY23, the percentage of consumers purchasing our portfolio of brands increased or remained stable in the majority of our markets, according to our estimates. Our brand, pack and liquid innovations drove increased participation with female consumers across key markets in Africa, Latin America and Europe, and new legal drinking age consumers in the US and Canada.
- Core Superiority:Our mainstream portfolio delivered high-single digit revenue growth in FY23 with double-digit growth in markets such as South Africa, Colombia and Dominican Republic. Our mainstream brands gained or maintained share of segment in the majority of our key markets, according to our estimates.
- Occasions Development: Our global no-alcohol beer portfolio continued to outperform, delivering high-teens revenue growth in FY23, with our performance driven by Budweiser Zero and Corona Cero. Our digital direct-to-consumer products enabled us to develop deep consumer insights and new consumption occasions, such as Corona Sunset Hours, Brahma Soccer Wednesdays and increased in-home consumption of returnable glass bottle packs.
- Premiumization:Our above core beer portfolio grew revenue by low-teens in FY23, with our premium and super premium brands gaining share of segment in a number of key markets, including South Africa, Mexico and Brazil, according to our estimates. Our global megabrands grew revenue by 18.2% outside of their home markets led by Corona which grew by 22.1%. Budweiser delivered a revenue increase of 17.1%, with broad-based growth in more than 25 markets, Stella Artois grew by 18.8% and Michelob Ultra by 7.5%.
- Beyond Beer:In FY23,our Beyond Beer business contributed approximately 1.5 billion USD of revenue and grew by mid-single digits, as growth globally was partially offset by the performance of malt-based seltzer in the US. Growth was primarily driven by Brutal Fruit and Flying Fish in Africa, our spirits based ready-to-drink portfolio in the US and Beats in Brazil, all of which grew revenue by double-digits.
- Digitize and monetize our ecosystem
The digital transformation of our route to consumer is a fundamental evolution in how we do business and serve our customers. Our digital platforms are enabling us to increase the distribution of our brands, reduce our cost to serve and improve our relationship with customers and consumers. It is a key competitive advantage, and we continue to explore new ways to monetize our digital and physical assets to create additional profitable revenue streams.- Digitizing our relationships with our more than six million customers globally: As of 31 December 2023, BEES was live in 26 markets, with approximately 70% of our 4Q23 revenues captured through B2B digital platforms. In FY23, BEES reached 3.7 million monthly active users and captured 39.8 billion USD in gross merchandise value (GMV), growth of 27% versus FY22.
BEES Marketplace was live in 15 markets with 67% of BEES customers also Marketplace buyers. Marketplace captured approximately 1.5 billion USD in GMV from sales of third-party products this year, growth of 52% versus FY22. - Leading the way in DTC solutions: Our omnichannel direct-to-consumer (DTC) ecosystem of digital and physical products generated revenue of approximately 1.5 billion USD this year. Our DTC megabrands, Zé Delivery, TaDa and PerfectDraft are available in 21 markets, fulfilled over 69 million e-commerce orders and generated revenue of more than 550 million USD in FY23, growth of 15% versus FY22.
- Unlocking value from our ecosystem: We continue to explore opportunities to generate scalable incremental revenue streams for our business through EverGrain, our upcycled barley ingredients company, and Biobrew, our precision fermentation venture.
- Digitizing our relationships with our more than six million customers globally: As of 31 December 2023, BEES was live in 26 markets, with approximately 70% of our 4Q23 revenues captured through B2B digital platforms. In FY23, BEES reached 3.7 million monthly active users and captured 39.8 billion USD in gross merchandise value (GMV), growth of 27% versus FY22.
- Optimize our business
- Maximizing value creation: Our objective to maximize long-term value creation is driven by our focus on three areas: optimized resource allocation, robust risk management and an efficient capital structure. Our culture of everyday financial discipline enables us to optimize resource allocation and invest for growth. In FY23, we invested 11.6 billion USD in capex and sales and marketing while delivering free cash flow of approximately 8.8 billion USD, a 0.3 billion USD increase versus FY22.
We continued to deleverage, reducing gross debt by 1.8 billion USD to reach 78.1 billion USD, resulting in a net debt to EBITDA ratio of 3.38x as of 31 December 2023. Our robust risk management was recognized earlier this year with a credit rating upgrade from Baa1 to A3 by Moody’s and from BBB+ to A- by S&P.
As a result, we have additional flexibility in our capital allocation choices. The AB InBev Board of Directors has proposed a full year dividend of 0.82 EUR per share, a 9% increase versus FY22. In addition, as of 23rd February 2024 we have completed nearly 90% of our 1 billion USD share buyback program announced on 31 October 2023. - Advancing our sustainability priorities: In FY23, we continued to make progress towards our ambitious 2025 Sustainability Goals. We contracted the equivalent of 100% of our global purchased electricity volume from renewable sources with 73.6% operational. Since 2017, we reduced our absolute GHG emissions across Scopes 1 and 2 by 44% and GHG emissions intensity across Scopes 1, 2 and 3 by 24.2%. In Sustainable Agriculture, 95% of our direct farmers met our criteria for skilled, 92% for connected and 86% for financially empowered. In Water Stewardship, we are investing in restoration and conservation efforts across 100% of our sites in high stress areas, with 56% of sites in scope for our 2025 goal already seeing measurable improvement in watershed health. For Circular Packaging, 77.5% of our products were in packaging that was returnable or made from majority recycled content. We are also progressing on our ambition to achieve net zero by 2040, with 36 lighthouse projects implemented worldwide in 2023.
In recognition of our leadership in corporate transparency and performance on climate change and water security, we were awarded a double A score by CDP.
We are committed to Smart Drinking and improving moderation habits all over the world. Since 2016, we have invested 900 million USD in social norms marketing and are on track to deliver our 1 billion USD goal by 2025. We have also undertaken the largest voluntary guidance labeling initiative, with 100% of our labels now featuring Smart Drinking icons and moderation actionable messages in 26 markets.
Please refer to our Sustainability Statements in our 2023 annual report here for further details.
- Maximizing value creation: Our objective to maximize long-term value creation is driven by our focus on three areas: optimized resource allocation, robust risk management and an efficient capital structure. Our culture of everyday financial discipline enables us to optimize resource allocation and invest for growth. In FY23, we invested 11.6 billion USD in capex and sales and marketing while delivering free cash flow of approximately 8.8 billion USD, a 0.3 billion USD increase versus FY22.
Looking forward
As we reflect on 2023, while our full potential was constrained, the fundamental strengths of our business drove another year of consistent profitable growth. Beer is a large, profitable and growing category, gaining share of alcohol globally and with significant headroom for premiumization. Our diversified footprint, global scale and unparalleled ecosystem uniquely position us to lead and grow the category. We have replicable growth drivers such as our portfolio of megabrands that consumers love, digital products that unlock value and a category expansion model that drives organic growth. Our business generates superior profitability and cash generation, and our dynamic capital allocation framework provides us flexibility to maximize value creation. The resilience, relentless commitment and deep ownership culture of our people is truly unwavering, and we thank all our colleagues globally for their hard work and dedication.
Looking ahead to 2024, our purpose as a company remains as relevant as ever. Guided by our strategy and our focus on customer and consumer centricity, we are energized about the opportunities ahead to activate the category through our megabrands and platforms. We believe in the potential of the beer category, the fundamentals of our company and our people, and our ability to generate superior long-term value and create a future with more cheers.
2024 Outlook
(i) Overall Performance: We expect our EBITDA to grow in line with our medium-term outlook of between 4-8%1. The outlook for FY24 reflects our current assessment of inflation and other macroeconomic conditions.
(ii) Net Finance Costs: Net pension interest expenses and accretion expenses are expected to be in the range of 220 to 250 million USD per quarter, depending on currency and interest rate fluctuations. We expect the average gross debt coupon in FY24 to be approximately 4%.
(iii) Effective Tax Rates (ETR): We expect the normalized ETR in FY24 to be in the range of 27% to 29%. The ETR outlook does not consider the impact of potential future changes in legislation.
(iv) Net Capital Expenditure: We expect net capital expenditure of between 4.0 and 4.5 billion USD in FY24.
|
1Please refer to the FY24 presentation update on organic growth on page 16 |
|
Figure 1. Consolidated performance (million USD) |
|||
|
4Q22 |
4Q23 |
Organic |
|
|
growth |
|||
|
Total Volumes (thousand hls) |
148 775 |
144 706 |
-2.6% |
|
AB InBev own beer |
128 502 |
123 764 |
-3.6% |
|
Non-beer volumes |
19 421 |
19 998 |
3.0% |
|
Third party products |
853 |
944 |
13.1% |
|
Revenue |
14 668 |
14 473 |
6.2% |
|
Gross profit |
8 007 |
7 794 |
5.3% |
|
Gross margin |
54.6% |
53.9% |
-49 bps |
|
Normalized EBITDA |
4 947 |
4 877 |
6.2% |
|
Normalized EBITDA margin |
33.7% |
33.7% |
-2 bps |
|
Normalized EBIT |
3 608 |
3 491 |
6.9% |
|
Normalized EBIT margin |
24.6% |
24.1% |
16 bps |
|
|
|||
|
Profit attributable to equity holders of AB InBev |
2 844 |
1 891 |
|
|
Underlying profit attributable to equity holders of AB InBev |
1 739 |
1 661 |
|
|
|
|||
|
Earnings per share (USD) |
1.41 |
0.94 |
|
|
Underlying earnings per share (USD) |
0.86 |
0.82 |
|
|
FY22 |
FY23 |
Organic |
|
|
growth |
|||
|
Total Volumes (thousand hls) |
595 133 |
584 728 |
-1.7% |
|
AB InBev own beer |
517 990 |
505 899 |
-2.3% |
|
Non-beer volumes |
73 241 |
74 810 |
2.1% |
|
Third party products |
3 903 |
4 019 |
4.7% |
|
Revenue |
57 786 |
59 380 |
7.8% |
|
Gross profit |
31 481 |
31 984 |
6.7% |
|
Gross margin |
54.5% |
53.9% |
-53 bps |
|
Normalized EBITDA |
19 843 |
19 976 |
7.0% |
|
Normalized EBITDA margin |
34.3% |
33.6% |
-23 bps |
|
Normalized EBIT |
14 768 |
14 590 |
6.4% |
|
Normalized EBIT margin |
25.6% |
24.6% |
-31 bps |
|
|
|||
|
Profit attributable to equity holders of AB InBev |
5 969 |
5 341 |
|
|
Underlying profit attributable to equity holders of AB InBev |
6 093 |
6 158 |
|
|
|
|||
|
Earnings per share (USD) |
2.97 |
2.65 |
|
|
Underlying earnings per share (USD) |
3.03 |
3.05 |
|
|
Figure 2. Volumes (thousand hls) |
||||||
|
4Q22 |
Scope |
Organic |
4Q23 |
Organic growth |
||
|
growth |
Total |
Own beer |
||||
|
North America |
23 451 |
- 149 |
-3 563 |
19 738 |
-15.3% |
-16.2% |
|
Middle Americas |
38 286 |
- |
348 |
38 635 |
0.9% |
0.9% |
|
South America |
46 860 |
- |
- 157 |
46 704 |
-0.3% |
-2.0% |
|
EMEA |
24 094 |
50 |
- 180 |
23 964 |
-0.7% |
-1.0% |
|
Asia Pacific |
15 903 |
- |
- 438 |
15 465 |
-2.8% |
-2.9% |
|
Global Export and Holding Companies |
181 |
-52 |
71 |
200 |
55.0% |
54.8% |
|
AB InBev Worldwide |
148 775 |
- 151 |
-3 919 |
144 706 |
-2.6% |
-3.6% |
|
FY22 |
Scope |
Organic |
FY23 |
Organic growth |
||
|
growth |
Total |
Own beer |
||||
|
North America |
102 674 |
-118 |
-12 417 |
90 140 |
-12.1% |
-12.6% |
|
Middle Americas |
147 624 |
- |
1 106 |
148 730 |
0.7% |
0.1% |
|
South America |
164 319 |
- |
-1 859 |
162 460 |
-1.1% |
-2.0% |
|
EMEA |
90 780 |
204 |
- 771 |
90 213 |
-0.8% |
-1.1% |
|
Asia Pacific |
88 898 |
- |
3 828 |
92 726 |
4.3% |
4.2% |
|
Global Export and Holding Companies |
838 |
-236 |
-143 |
459 |
-23.7% |
-26.4% |
|
AB InBev Worldwide |
595 133 |
- 151 |
-10 255 |
584 728 |
-1.7% |
-2.3% |
Key Market Performances
United States: Revenue declined by 9.5% impacted by volume performance
- Operating performance:
- 4Q23: Revenue declined by 17.3% with sales-to-retailers (STRs) down by 12.1%, primarily due to the volume decline of Bud Light. Sales-to-wholesalers (STWs) declined by 16.1% as shipments lagged stronger depletions in December. Revenue per hl decreased by 1.4% due to negative mix and cycling the October price increase in 4Q22. EBITDA declined by 34.2%, with approximately two thirds of this decrease attributab