
Halliburton stock gains as dividend goes ex and oil volatility supports outlook
Published on 09/02/2026 at 21:13 | Editorial responsibility: Rafael Müller, Editor-in-Chief AD HOC NEWS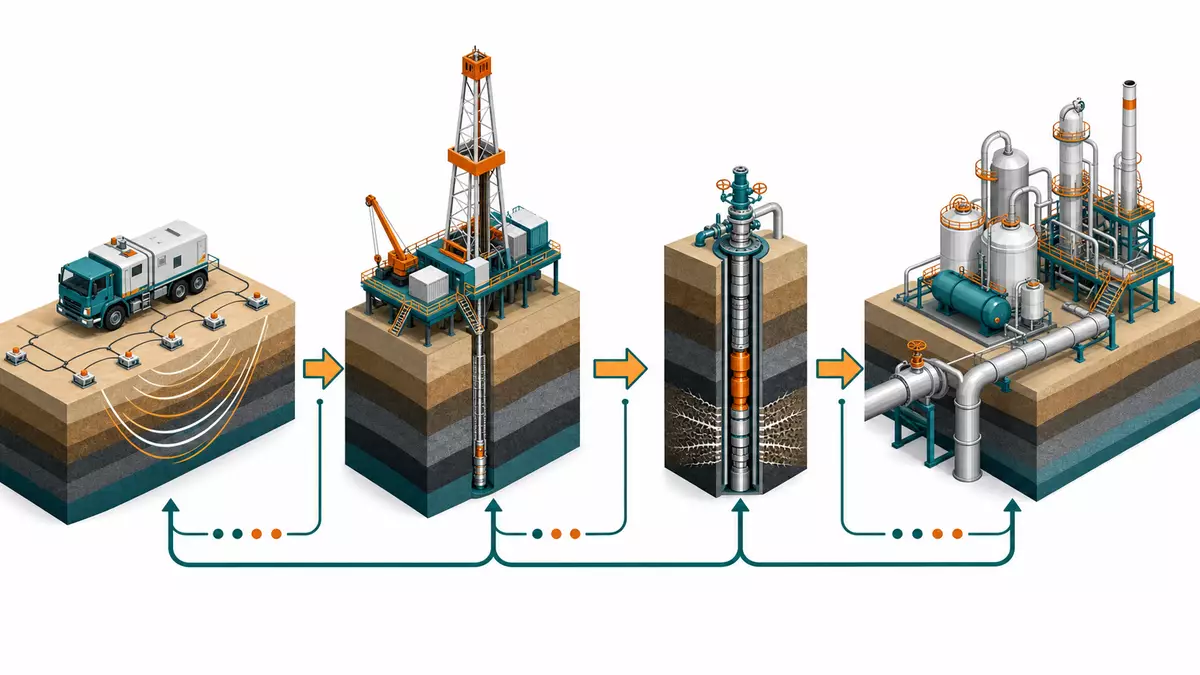
Halliburton Company (ISIN US4062161017) stock is trading around 37.61 USD as of September 2, 2026, with an intraday gain of 2.68 percent according to market data from Yahoo Finance.
Dividend ex-date and recent price action
According to data compiled by Yahoo Finance, Halliburton stock was quoted at 37.61 USD in New York trading on September 2, 2026, with a move of 0.98 USD or 2.68 percent on the day.
The same overview shows that Halliburton has declared a quarterly cash dividend of 0.17 USD per share, with the ex-dividend date falling on September 2, 2026 and payment scheduled for September 23, 2026.
Latest quarterly figures and analyst consensus
In its most recent reported quarter, Halliburton delivered non-GAAP earnings per share of 0.55 USD, slightly above the consensus estimate of 0.54 USD, based on an earnings snapshot cited by Seeking Alpha.
The same quarterly release showed revenue of 5.71 billion USD, compared with analyst expectations of about 5.50 billion USD, meaning Halliburton generated roughly 210 million USD more sales than the consensus view in that period.
MarketBeat data referenced in an analyst-focused note reports that Halliburton recorded a return on equity of 18.71 percent and a net margin of 7.16 percent in the latest quarter, with quarterly revenue up 3.7 percent year on year and earnings per share of 0.55 USD matching the prior-year quarter.
More facts and documents on Halliburton
For investors who want to track Halliburton stock more closely, the following overview and the company's own investor materials offer additional figures and background.
Oil price swings and regional mix
A recent technical note on energy stocks from Futu indicates that Halliburton shares showed a bullish continuation triangle pattern around the 37.96 USD resistance level and 36.44 USD as a reference support level as of September 2, 2026, with the stock rising by more than 4 percent on the day in the context of a more than 3 percent move higher in crude oil prices.
The earnings analysis on Seeking Alpha points out that in the latest quarter North America revenue rose 7 percent sequentially to about 2.3 billion USD, while international revenue advanced across several regions, underscoring that Halliburton's growth is now driven by both North American and overseas markets.
Pressure pumping and well services as core product
A central product and service area for Halliburton is pressure pumping and well completion services, which support hydraulic fracturing and production optimization for oil and gas wells in North America and international basins.
Stock level and investor takeaway
With Halliburton stock trading around 37.61 USD as of September 2, 2026, near the 37.96 USD chart level highlighted by recent technical commentary, the shares are not far from the resistance zone cited in the short term.
Key data for Halliburton
- Company: Halliburton Company
- ISIN: US4062161017
- Ticker: HAL
- Trading venue: NYSE
- Price (as of September 2, 2026, 14:00): 37.61 USD
- Market capitalization: 33,000,000,000 USD (as of September 2, 2026)
- Sector / Industry: Energy equipment and services
- Index membership: S&P 500


