
CME Group stock holds above $270 as investors eye earnings beat and steady dividend
Published on 08/19/2026 at 10:44 | Editorial responsibility: Rafael Müller, Editor-in-Chief AD HOC NEWS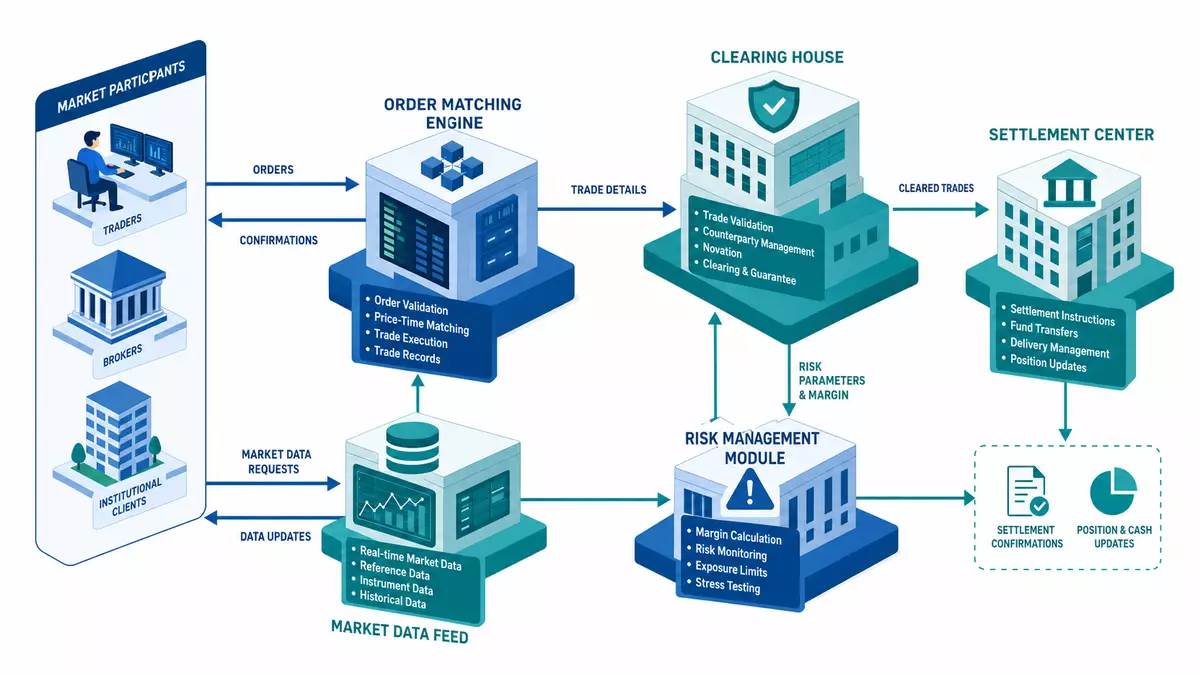
CME Group Inc. (US12572Q1058) stock is trading at $271.54 as of August 18, 2026, reflecting investors ongoing confidence after the derivatives marketplace recently reported earnings that surpassed Wall Street expectations.
Stock price and market performance
According to a market-data overview for August 18, 2026, CME Group stock closed at $271.54, with the shares up 1.37 percent on the day and showing a year-to-date gain of 4.71 percent.
Intraday trading on August 19, 2026, shows CME stock changing hands around $272.00, within a daily range between $267.88 and $274.00 and on a volume of 1.47 million shares against an average daily volume of 1.68 million.
On a medium-term basis, CME stock is trading modestly below an average analyst price target of $291.81, implying upside potential of several percentage points if the shares eventually close that gap.
Latest earnings and profitability
Recent coverage of CME Group indicates that the company most recently reported quarterly results on July 22, 2026, delivering earnings per share of $2.99 for that period.
That $2.99 EPS figure exceeded consensus expectations of $2.91 by $0.08, underscoring the firm’s ability to turn strong derivatives trading activity into robust profitability.
For the same quarter in the previous year, CME earned $2.96 per share, so the latest $2.99 print represents a modest year-over-year increase despite already high profit levels.
The company generated revenue of $1.71 billion in that latest reported quarter, marginally ahead of the $1.68 billion that analysts had anticipated, and up 0.8 percent compared with the revenue level in the corresponding quarter one year earlier.
With a return on equity of 15.60 percent and a net margin of 63.30 percent in the most recent quarter, CME Group maintains one of the stronger profitability profiles in the financial-exchange sector.
Dividend policy and income profile
CME Group continues to position itself as an income-oriented stock in the exchanges space, supported by a regular cash payout complemented historically by special distributions.
In connection with its recent results, the company declared a quarterly dividend of $1.30 per share to be paid on September 25, 2026, to shareholders of record as of September 9, 2026.
This $1.30 quarterly dividend translates into an annualized payout of $5.20 per share, which at a share price around $271.54 works out to a dividend yield of 1.9 percent.
The latest figures show a dividend payout ratio of 44.11 percent, leaving CME with flexibility to reinvest in growth initiatives and maintain balance-sheet strength while still returning significant cash to shareholders.
Analyst expectations and valuation context
Across recent equity research updates, CME Group carries a consensus rating characterized as Hold, with an average or consensus price target of $291.81 for the stock.
With the latest closing price at $271.54 on August 18, 2026, that consensus target stands 7.5 percent above the current level, indicating that the market price embeds cautious expectations relative to analysts’ medium-term assumptions.
Given the company’s last reported earnings per share of $2.99 for a single quarter and a consensus full-year EPS estimate of 12.27, the stock’s valuation effectively prices in steady mid-teens profitability and a continuation of its high-margin business model.
The modest spread between CME’s current trading level and the average target price suggests that investors are balancing the appeal of its stable cash flows and dividend with sensitivity to interest rates and trading-volume cycles.
Institutional interest and ownership trends
Recent regulatory filings highlight ongoing institutional interest in CME Group shares, supporting liquidity and signaling confidence among professional investors.
One disclosure for the second quarter shows a fund acquiring 40,726 shares of CME, with that stake valued at $10,400,000 based on prevailing market prices during the period.
Other investment managers have reported new or increased positions in CME stock, adding stakes measured in the low thousands of shares, indicating that the name continues to play a role as a core holding in many diversified portfolios.
This pattern of institutional activity often aligns with the stock’s profile as a large-cap, dividend-paying financial-services company with a leading position in derivatives markets.
Trading volume and liquidity profile
On August 19, 2026, intraday figures show CME Group stock trading with a volume of 1.47 million shares, compared with a recent average daily volume of 1.68 million shares.
In the prior regular trading session ending August 18, 2026, the stock’s closing price of $271.54 was accompanied by a move of 1.37 percent on the day, placing the shares modestly within their recent range and signaling active participation by both long-term and short-term investors.
A five-day performance snapshot for that date shows a gain of 1.37 percent, while the year-to-date change stands at 4.71 percent, underscoring that CME has delivered positive but measured gains during the current calendar year.
This trading profile positions the stock as a relatively steady name within the financial sector, with ample liquidity for institutional-sized orders and a volatility pattern that often reflects macro factors such as interest-rate expectations and futures trading volumes.
Business model and revenue drivers
CME Group operates a broad-based derivatives marketplace, offering trading across interest rates, equity indexes, foreign exchange, energy, metals, and agricultural products.
The company’s revenue in the most recent reported quarter of $1.71 billion is primarily driven by transaction fees on futures and options contracts, along with associated clearing and market-data services.
Because derivatives volumes tend to increase during periods of heightened market uncertainty, CME’s top line often benefits from elevated volatility, even as it maintains a diversified contract suite that spans multiple asset classes.
In that context, the modest 0.8 percent year-over-year revenue increase in the latest quarter illustrates how incremental growth in key contracts can support steady expansion even against a high base of existing activity.
Product spotlight - soybean futures and CVOL index
Among its many offerings, CME Group’s agricultural derivatives platform includes soybean futures, which provide hedging and speculative opportunities for producers, traders, and investors.
The exchange also offers a Soybean Volatility Index, a measure designed to capture 30-day implied volatility derived from options on soybean futures, giving market participants a forward-looking gauge of risk expectations in this commodity.
By integrating tools such as the soybean CVOL index with its core futures contracts, CME enables users to manage both price and volatility risk in a more granular way, reflecting the company’s focus on sophisticated risk-management solutions.
Such product innovation can support long-term revenue growth as clients expand their use of advanced hedging strategies and incorporate volatility metrics into their trading frameworks.
Outlook and earnings trajectory
Analysts currently project that CME Group will deliver full-year earnings per share of 12.27, based on the latest compiled estimates.
Comparing that projection with the most recently reported quarterly EPS of $2.99 suggests that the market expects earnings to remain broadly stable across coming quarters, with room for moderate growth if trading volumes and fee structures remain favorable.
The company’s strong net margin of 63.30 percent provides a significant buffer against cyclical swings in activity, allowing it to sustain high profitability even if certain asset classes experience periods of lower volume.
In addition, the 15.60 percent return on equity highlights an efficient use of shareholder capital, which can be particularly important for investors who view CME as a long-term compounder rather than a purely cyclical trade.
Risk factors and macro sensitivity
Despite its strengths, CME Group is not immune to broader macroeconomic and regulatory developments.
Changes in interest-rate expectations can influence demand for rate-related futures, while shifts in equity market volatility affect index-based contracts and associated options.
Regulatory changes in derivatives markets, including potential adjustments to margin requirements or clearing mandates, can also impact the company’s cost structure and product mix.
Nonetheless, CME’s diversified contract lineup and global client base help mitigate concentration risks, making its earnings stream less dependent on any single asset class or region.
Investor takeaway on CME Group stock
For investors evaluating CME Group stock as of August 19, 2026, several key metrics stand out.
The latest closing price of $271.54 positions the shares below the consensus target of $291.81, while the company’s recent quarterly EPS of $2.99 and revenue of $1.71 billion illustrate a business that is both highly profitable and still growing incrementally.
With an annualized dividend of $5.20 per share and a payout ratio of 44.11 percent, CME offers a blend of income and growth characteristics that may appeal to investors seeking exposure to market-infrastructure providers.
The quantified comparison between current price levels and the average target, as well as between recent and prior-year earnings, underscores a narrative of steady progress rather than dramatic swings, aligning with the stock’s reputation as a relatively stable financial name.
CME Group derivatives platform
Beyond headline financial figures, CME’s role as a central node in global derivatives markets underscores its strategic importance.
The combination of flagship interest-rate contracts, benchmark equity index futures, and specialized instruments such as soybean volatility indices illustrates a broad toolkit that serves hedgers and speculators alike.
As electronic trading and cross-margining capabilities continue to evolve, CME’s integrated platform can reinforce customer loyalty and deepen ties with institutional clients, potentially supporting continued growth in volumes and fee income.
These structural advantages, alongside disciplined capital allocation and a consistent dividend, help frame the investment narrative around CME Group stock at current levels.
CME Group stock and recent pricing
In the latest completed regular session on Nasdaq, CME Group stock closed at $271.54 on August 18, 2026, reflecting a daily gain of 1.37 percent.
This closing price aligns with intraday indications around $272.00 on August 19, 2026, keeping the stock within a trading band that has seen lows of $267.88 and highs of $274.00 in the most recent session.
Investors who track the stock’s combination of earnings strength, dividend income, and derivative-market exposure will continue to watch how future quarterly results and interest-rate dynamics influence CME’s valuation in the months ahead.
Fact box
Company: CME Group Inc.
ISIN: US12572Q1058
Ticker: CME
Exchange: Nasdaq
Price (as of August 18, 2026, 4:00 p.m. ET): $271.54 USD
Market cap: $97.64 billion (as of August 19, 2026)


