

ASM stock falls 3.19 percent to EUR 848.40 in trading
Published on 10/13/2026 at 13:23 | Editorial responsibility: Rafael Müller, Editor-in-Chief AD HOC NEWS- ASM stock fell 3.19 percent against the October 12, 2026 Euronext Amsterdam close.
- ASM reported EUR 3.20 billion revenue in fiscal 2025, with a 51.80 percent gross margin.
- ASM stock costs EUR 848.40 at Lang & Schwarz on October 13, 2026 at 1:13 p.m. CEST, 3.19 percent below the Euronext close of October 12, 2026.
- ASM trades at a P/E ratio of 38.94, while quarterly results are scheduled for October 27, 2026.
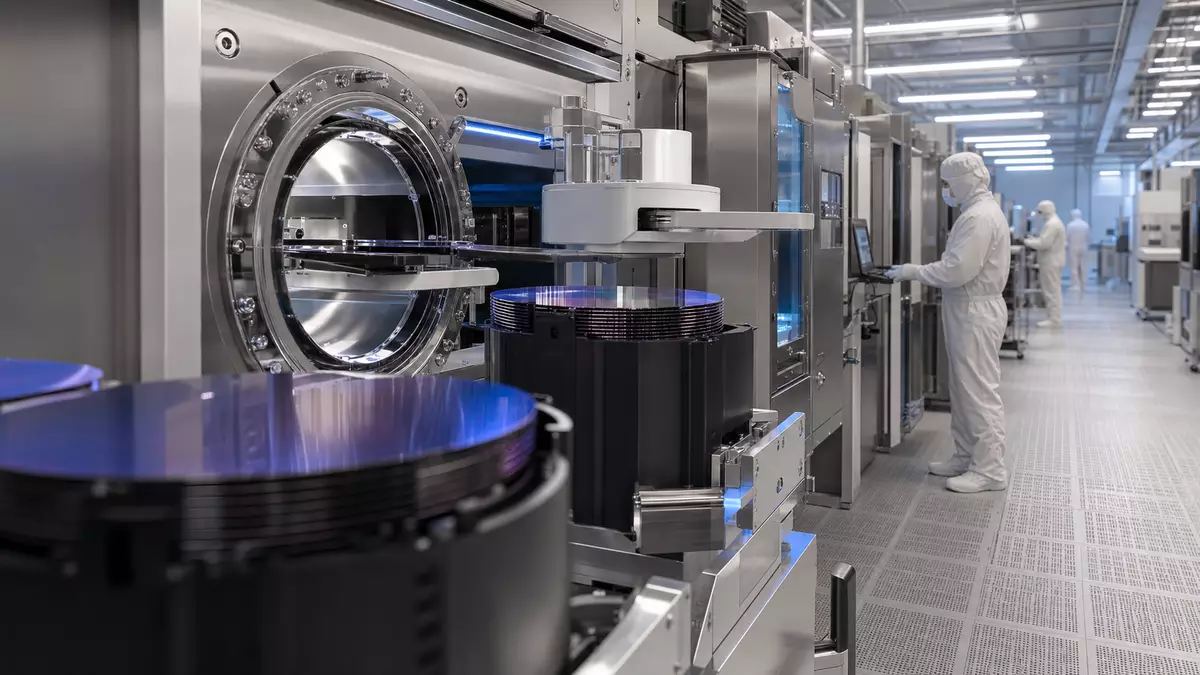
ASM International stock (ISIN NL0000334118) fell 3.19 percent to EUR 848.40 at Lang & Schwarz on October 13, 2026 at 1:13 p.m. CEST, versus the Euronext Amsterdam close of EUR 876.40 on October 12, 2026. The move puts the semiconductor equipment maker below its recent valuation levels while keeping the share within its 52-week range.
Fiscal 2025 set the base
ASM reports EUR 3.20 billion revenue, a 51.80 percent gross margin and a 29.60 percent operating margin for fiscal 2025. Free cash flow reached EUR 434.0 million in the same fiscal year, giving investors a dated operating baseline for the current valuation.
The mix of revenue, margin and cash flow matters because the company sells wafer-processing equipment to leading chip manufacturers. Revenue is the scale measure, while the margin figures show how much of that sales base remained after production and operating costs.
Price stays below the yearly high
ASM's 52-week range was EUR 459.70 to EUR 1,092.50 as of October 13, 2026. At EUR 848.40, the Lang & Schwarz price stood 22.36 percent below the 52-week high, while the session volume on Euronext Amsterdam was 38,140 shares against an average volume of 162,758 shares.
The current quote also sits 84.55 percent above the 52-week low. That spread places the stock materially closer to its yearly high than its yearly low, even after the 3.19 percent decline against the October 12 Euronext close.
Valuation and October 27 results
ASM had a market capitalization of EUR 41.7 billion and a P/E ratio of 38.94 as of October 13, 2026. The annual dividend yield was 0.00 percent in the same market snapshot, so the valuation case rests primarily on earnings and operating execution rather than current income.
TickerLandia lists October 27, 2026 as ASM's next quarterly-results date. The upcoming report gives the market a new period for testing whether the fiscal 2025 operating profile is carrying into the second half of 2026.
Comparison with peers
ASM: minus 3.19 percent, P/E 38.94, market capitalization EUR 41.7 billion.
ASML (Euronext Amsterdam, EUR): minus 2.01 percent, P/E 56.09, market capitalization EUR 595.2 billion.
BE Semiconductor Industries (Euronext Amsterdam, EUR): minus 2.02 percent, P/E 66.12, market capitalization EUR 13.6 billion.
Price and investor frame
ASM was trading at EUR 848.40 at Lang & Schwarz on October 13, 2026 at 1:13 p.m. CEST, down 3.19 percent versus the Euronext Amsterdam close of EUR 876.40 on October 12, 2026. The further course of trading is shown by the continuously updated real-time quote of ASM stock.
ASM International key facts
- Company: ASM International N.V.
- ISIN: NL0000334118
- Ticker: ASM.AS
- Primary exchange: Euronext Amsterdam
- Price Lang & Schwarz as of October 13, 2026 at 1:13 p.m. CEST: EUR 848.40
- Change versus Euronext close of October 12, 2026: minus 3.19 percent
- Euronext close October 12, 2026: EUR 876.40
- Market capitalization: EUR 41.7 billion as of October 13, 2026
- 52-week range: EUR 459.70-EUR 1,092.50 as of October 13, 2026
- Sector / Industry: Technology / Semiconductors
- Next earnings date: October 27, 2026
Market context: Market report AEX.


