
Almonty Industries stock extends year-to-date rally as dual delisting and Sangdong growth reshape the tungsten story
Published on 08/26/2026 at 08:19 | Editorial responsibility: Rafael Müller, Editor-in-Chief AD HOC NEWS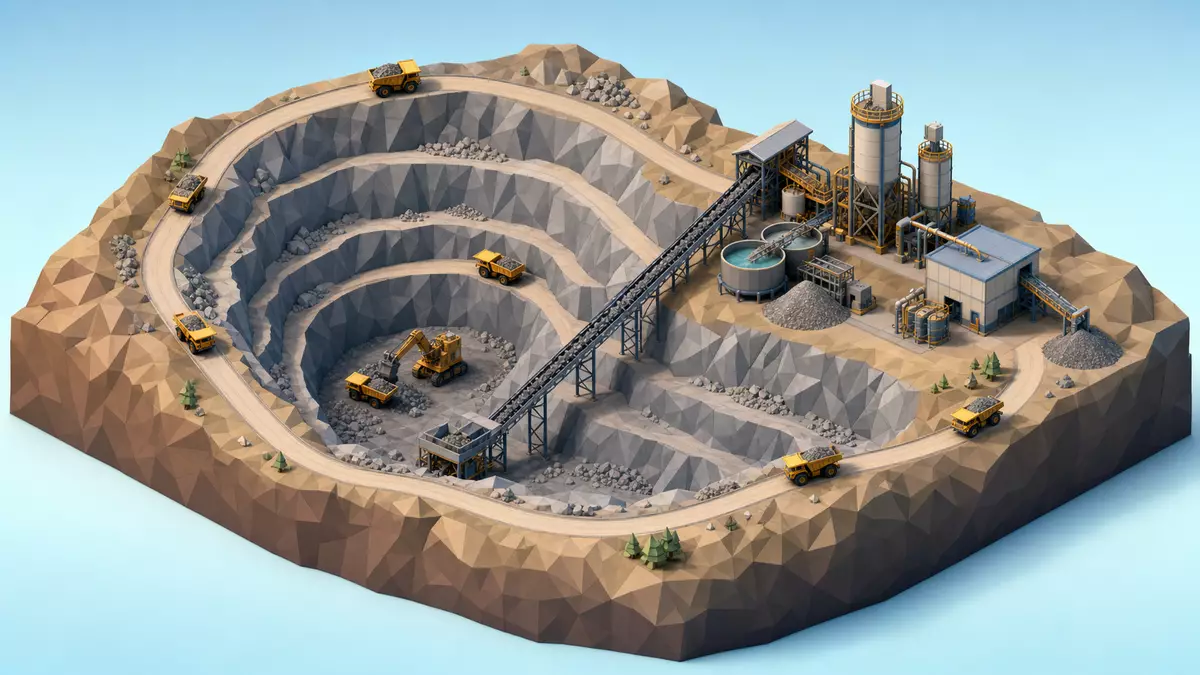
Almonty Industries Inc. (CA0203987072) stock has delivered a triple-digit gain in 2026 as the tungsten producer combines a strategic dual delisting with fast-growing cash flows from its Sangdong mine in South Korea, with shares also supported by a large buyback program as of August 26, 2026 per recent market coverage.
Listings concentrate on Nasdaq and Frankfurt
Recent reporting explains that Almonty Industries has decided to streamline its listings, exiting the Toronto Stock Exchange at the close of trading on July 31, 2026 and preparing to leave the Australian Securities Exchange at the close of business on August 28, 2026. In place of its broader multi-venue presence, the company will keep two core listings, with its stock traded on Nasdaq under the ticker ALM and on the Frankfurt exchange under ALI1 per a detailed analysis of its latest moves the Ad-hoc News coverage of listings and tungsten strategy. Market commentary links this consolidation to a liquidity strategy, concentrating trading activity in North America and Europe while the Asia-Pacific listing is retired.
Coverage of the delisting timetable indicates that the CHESS Depositary Interests traded in Sydney, representing 0.80 percent of issued shares, are scheduled for their final trading day on August 28, 2026, with the formal ASX delisting to follow on September 1, 2026 another Ad-hoc News article on the dual delisting. For investors who previously held positions via the Toronto or Sydney venues, the practical consequence is a shift: positions must be migrated to Nasdaq or Frankfurt or be unwound as those listings disappear.
Share performance and technical context
Market data compiled in recent German-language analyses show that Almonty Industries shares on the Frankfurt exchange closed at EUR16.18 on August 25, 2026, up 3.8 percent on the day, after what has been described as a powerful multi-month rally the same Ad-hoc News article with Frankfurt price data. That EUR16.18 closing level stands 22 percent below the 52-week high of EUR20.61 reached in April 2026, underlining that there is still a concrete gap to the stock’s peak despite the strong advance. At the same time, the shares are reported to be 383 percent above their 52-week low of EUR3.33, highlighting how dramatically the market has repriced the company over the past year.
Complementary commentary on performance in 2026 states that Almonty Industries stock has gained 104 percent since the start of the year and has produced a 340 percent return over the past twelve months, based on the EUR16.20 area as a recent Frankfurt trading level and the same EUR20.61 52-week high from April 2026 a Trading-Treff article that combines Sangdong mine data with performance metrics. This side-by-side view of year-to-date and twelve-month performance underscores how the rally has unfolded in stages and offers a quantified comparison for investors assessing momentum versus remaining upside to the prior high.
On the Nasdaq listing, a recent real-time quote overview shows Almonty Industries trading at $18.51 as of August 24, 2026, with a daily trading range between $18.00 and $19.06 and a 52-week range stretching from a low of $3.97 to a high of $24.41 a Nasdaq-focused market-data overview. The same overview assigns the company a market capitalization of $5.34 billion as of August 24, 2026 and an earnings per share figure on a trailing-twelve-month basis of $0.41, providing a concise snapshot of valuation and profitability in dollar terms.
Latest quarterly results transform the income statement
Against the backdrop of the listing changes and share-price strength, the most recent quarterly report illustrates a sharp shift in Almonty Industries financial profile. For the three months ended June 30, 2026, revenue reached CAD43.0 million compared with CAD7.2 million in the same quarter of 2025, as described in a detailed review of the company’s second-quarter numbers an Ad-hoc News analysis of Q2 2026 results. That year-over-year change represents an increase of CAD35.8 million in quarterly revenue, lifting the top line by 497 percent and illustrating the earnings impact of ramping output from the company’s tungsten operations.
The same second-quarter review notes that the bottom line swung from a net loss of CAD58.2 million in the three months ended June 30, 2025 to a net profit of CAD181.8 million in the three months ended June 30, 2026 the same Q2 2026 discussion highlighting net income. This swing totals CAD240.0 million on the net-income line, moving from a significant loss to a large profit within one year. Adjusted EBITDA is reported to have shifted from negative CAD4.8 million in the quarter ended June 30, 2025 to positive CAD17.6 million in the quarter ended June 30, 2026, a change of CAD22.4 million that signals improved operating leverage as revenue scales.
Within that quarter, earnings per share on an unadjusted basis are stated at $0.64 in US dollars, offering investors a per-share measure aligned with the Nasdaq listing the Q2 EPS note in US dollars. Separately, market-data services tracking the stock’s fundamentals show an EPS figure of $0.41 on a trailing-twelve-month basis as of August 24, 2026, which reflects a broader period than the single quarter and can be used for valuation comparisons against the prevailing $18.51 share price the same Nasdaq quote page carrying EPS and market cap.
Buyback program and valuation debate
Recent coverage emphasizes that Almonty Industries has a $300 million share buyback program in place, described as an active tailwind for the stock, with commentary noting that the shares have risen 3.0 percent since the program was initiated the Ad-hoc News article that pairs the buyback with tungsten market dynamics. For investors, such a buyback can support demand for the shares and signal management’s confidence in the company’s medium-term prospects for cash generation.
Alongside this supportive factor, independent valuation tools have flagged Almonty Industries shares as being priced well above one widely followed estimate of intrinsic value. A recent assessment shows the stock closing at $18.93 on August 25, 2026, with a GF Value of $3.81; the comparison between the $18.93 market price and the $3.81 GF Value implies that the shares are valued 396.9 percent above this benchmark, corresponding to a roughly fourfold premium over that model’s fair-value line a GuruFocus review of valuation versus GF Value. The same discussion assigns Almonty Industries a GF Score of 58 out of 100, categorized as average in that framework, and argues that the stock appears overvalued based on that set of metrics.
These contrasting signals, with a large authorized buyback on one side and a highlighted premium to one fair-value model on the other, frame the current debate for investors: whether the rapid improvement in quarterly earnings and strong share-price momentum justify paying above such valuation benchmarks, or whether risk-adjusted caution is warranted after such an aggressive rerating within a single year. The quantified 396.9 percent gap between the GF Value of $3.81 and the $18.93 market price as of August 25, 2026 offers a specific measure of how far sentiment has run ahead of that particular intrinsic-value yardstick.
Sangdong mine underpins revenue growth
On the operations side, the company’s Sangdong tungsten mine in South Korea is central to the improved revenue picture cited in the second quarter. An in-depth German-language feature notes that the Sangdong mine has been producing tungsten concentrate since July 2026, with the first expansion stage designed for an ore throughput capacity of 640,000 tonnes per year and a planned output of 2,300 tonnes of tungsten concentrate annually once ramp-up is complete the Trading-Treff discussion that details Sangdong capacity and contracts. A second expansion stage is already in planning, targeting a capacity of 1.2 million tonnes of ore per year, which would materially increase potential concentrate output over time.
The same feature draws attention to a long-term offtake agreement with Global Tungsten & Powders that was expanded in July 2026. According to that report, the contract duration has been extended by six years to a total of 21 years, with the committed offtake volume increased by 40 percent and pricing improved by 6.3 percent; Almonty Industries estimates that the annual revenue potential from this agreement could reach up to $490 million the same Trading-Treff explanation of the extended offtake agreement. For investors, this combination of production capacity and long-duration contracted demand provides visibility into future cash flows once the mine operates at its intended scale.
Commentary from the same article highlights that the share-price performance has mirrored this operational progress and the strengthened contract base. It notes that at a EUR16.20 level on the Frankfurt exchange, Almonty Industries shares are 104 percent higher year to date and 340 percent above their level twelve months ago, while still trading 21 percent below the EUR20.61 52-week high set in April 2026; the article also cites a 30-day annualized volatility of 92 percent and a market capitalization of EUR2.72 billion as key metrics for risk and size the Trading-Treff metrics on performance, volatility, and market cap. This reinforces that the stock’s strong advance has come with notable price swings, an important consideration when sizing positions.
Analyst expectations and earnings calendar
Looking ahead, an earnings-calendar overview of Almonty Industries points out that the company delivered earnings of $0.10 per share in its last reported quarter, matching the consensus estimate for that period, which represented a breakeven surprise an earnings-calendar style page that summarizes EPS and next report timing. The same overview states that the next earnings release is expected on November 2, 2026 and that the consensus forecast for that upcoming quarter stands at $0.11 per share, which is described as reflecting a 650 percent year-over-year increase in earnings.
Although the reported $0.11-per-share expectation and the 650 percent growth label could be interpreted as pointing toward a jump in earnings, investors should consider this forecast alongside the already documented swing in the June 30, 2026 quarter, where earnings per share on an unadjusted basis reached $0.64 in US dollars according to the detailed second-quarter review the unadjusted EPS note in the Q2 review. The interaction between these figures suggests that the consensus may be framed against prior quarters with much lower earnings, and that reported year-over-year percentages can be magnified when the base period consists of small or negative profits. As always, the actual reported numbers on November 2, 2026 will determine whether the forecasted 0.11-per-share outcome and the implied growth rates are achieved.
Representative product: Sangdong tungsten concentrate
Beyond the financial metrics and listing changes, Almonty Industries operational story is rooted in tungsten concentrate production from the Sangdong mine. The mine’s first expansion stage is expected to process 640,000 tonnes of ore annually, yielding 2,300 tonnes of tungsten concentrate once fully ramped according to the detailed operational breakdown the Trading-Treff operational breakdown of Sangdong concentrate output. Tungsten concentrate from Sangdong feeds into downstream applications that include hardmetals and tools for semiconductor manufacturing, aerospace, and defense, aligning the mine’s output with industries that are sensitive to long-term supply security.
Stock level and market snapshot
From a stock-price standpoint, recent quote data for the Nasdaq listing show Almonty Industries trading at $18.51 as of August 24, 2026, with that price associated with a 4.64 percent daily gain and a day range between $18.00 and $19.06 the Investing.com overview with intraday and 52-week ranges. As of the same date, the company’s market capitalization is indicated at $5.34 billion and the 52-week range at $3.97 to $24.41, placing the prevailing $18.51 level in the upper half of the past-year trading band but below the 52-week high, a positioning that may influence how investors think about risk and potential return.
Fact box
Company: Almonty Industries Inc.
ISIN: CA0203987072
Ticker: ALM
Exchange: Nasdaq
Price (as of August 24, 2026, 4:00 p.m. ET): $18.51 USD
Market cap: $5.34 billion (as of August 24, 2026)
Sector / Industry: Materials / Metals and Mining
Index membership: Nasdaq composite
Next earnings date: November 2, 2026


